Located at 6607 S Sangamon St in Englewood, near Ogden Park, Perkins Bass Elementary School, Englewood High School, and the 90/94 expressway, this fully gut-rehabbed two-unit building sits on a 3,125 sq ft lot featuring a rear yard and a two-car carport. The property comprises a 3-bedroom, 2-bathroom duplex-down unit and a 3-bedroom, 1-bathroom unit. Both units boast large living and dining rooms, hardwood floors throughout the living areas and bedrooms, individual gas forced air furnaces with central A/C, individual water heaters, in-unit laundry, and separate kitchens equipped with quartz countertops, gas ranges, microwaves, dishwashers, and refrigerators.
New
$440,000
6607 S Sangamon St, Chicago, IL 60621
6beds
--sqft
Multi Family
Built in 1914
-- sqft lot
$-- Zestimate®
$--/sqft
$-- HOA
What's special
Two-car carportIn-unit laundryGas rangesRear yard
- --
- 63
- views
- 11
- saves
Zillow last checked:
Listing updated:
Listed by:
Miguel Lopez (312)836-4263,
Redfin Corporation
Source: MRED as distributed by MLS GRID,MLS#: 12799131
Facts & features
Interior
Bedrooms & bathrooms
- Bedrooms: 6
- Bathrooms: 3
- Full bathrooms: 3
Heating
- Has Heating (Unspecified Type)
Appliances
- Included: Multiple Water Heaters
Features
- Basement: Finished,Full
Video & virtual tour
Property
Parking
- Total spaces: 2
- Parking features: Off Street, Yes, Owned
Features
- Patio & porch: Patio
Lot
- Size: 3,250 Square Feet
- Dimensions: 25 X 130
Details
- Parcel number: 20202290030000
- Special conditions: None
Construction
Type & style
- Home type: MultiFamily
- Architectural style: Brownstone
- Property subtype: Multi Family
Materials
- Brick
Condition
- New construction: No
- Year built: 1914
- Major remodel year: 2023
Utilities & green energy
- Sewer: Public Sewer
- Water: Lake Michigan
Community & HOA
Community
- Features: Curbs, Sidewalks, Street Lights, Street Paved
- Security: Security System
Location
- Region: Chicago
Financial & listing details
- Tax assessed value: $370,010
- Annual tax amount: $7,023
- Date on market: 11/12/2026
- Ownership: Fee Simple
Estimated market value
Not available
Estimated sales range
Not available
Not available
Price history
| Date | Event | Price |
|---|---|---|
| 8/18/2023 | Sold | $375,000-4.5% |
Source:  MRED as distributed by MLS GRID #11822549 Report a problem | ||
| 8/11/2023 | Pending sale | $392,500 |
Source: MRED as distributed by MLS GRID #11822549 Report a problem | ||
| 7/15/2023 | Contingent | $392,500 |
Source: MRED as distributed by MLS GRID #11822549 Report a problem | ||
| 7/4/2023 | Listed for sale | $392,500 |
Source: MRED as distributed by MLS GRID #11822549 Report a problem | ||
| 7/4/2023 | Listing removed | -- |
Source: MRED as distributed by MLS GRID #11796365 Report a problem | ||
| 6/20/2023 | Price change | $392,500-1.9% |
Source: MRED as distributed by MLS GRID #11796365 Report a problem | ||
| 6/13/2023 | Price change | $399,900-2.2% |
Source: MRED as distributed by MLS GRID #11796365 Report a problem | ||
| 6/1/2023 | Listed for sale | $409,000-1.4% |
Source: MRED as distributed by MLS GRID #11796365 Report a problem | ||
| 6/1/2023 | Listing removed | -- |
Source: MRED as distributed by MLS GRID #11787129 Report a problem | ||
| 5/19/2023 | Listed for sale | $415,000+280.7% |
Source: MRED as distributed by MLS GRID #11787129 Report a problem | ||
| 7/18/2022 | Listing removed | -- |
Source: MRED as distributed by MLS GRID #11401164 Report a problem | ||
| 5/11/2022 | Listed for sale | $109,000+3.8% |
Source: MRED as distributed by MLS GRID #11401164 Report a problem | ||
| 2/2/2022 | Listing removed | -- |
Source: MRED as distributed by MLS GRID #11230817 Report a problem | ||
| 12/27/2021 | Price change | $105,000-4.1% |
Source: MRED as distributed by MLS GRID #11230817 Report a problem | ||
| 11/15/2021 | Price change | $109,500-4.8% |
Source: MRED as distributed by MLS GRID #11230817 Report a problem | ||
| 10/28/2021 | Listed for sale | $115,000 |
Source: MRED as distributed by MLS GRID #11230817 Report a problem | ||
| 10/8/2021 | Contingent | $115,000 |
Source: MRED as distributed by MLS GRID #11230817 Report a problem | ||
| 9/27/2021 | Price change | $115,000+4.5% |
Source: MRED as distributed by MLS GRID #11230817 Report a problem | ||
| 8/16/2021 | Listed for sale | $110,000 |
Source: Owner Report a problem | ||
Public tax history
| Year | Property taxes | Tax assessment |
|---|---|---|
| 2024 | $6,772 +817.3% | $37,001 +957.5% |
| 2023 | $738 +2.6% | $3,499 |
| 2022 | $720 +2.3% | $3,499 |
| 2021 | $704 -49.2% | $3,499 -43.7% |
| 2020 | $1,386 -2.4% | $6,220 -12% |
| 2019 | $1,420 +1.7% | $7,069 |
| 2018 | $1,396 -56.6% | $7,069 -52.7% |
| 2017 | $3,219 +7.5% | $14,953 |
| 2016 | $2,995 +9.3% | $14,953 |
| 2015 | $2,740 +9.9% | $14,953 +11.3% |
| 2014 | $2,493 +2% | $13,438 |
| 2013 | $2,444 +1.4% | $13,438 |
| 2012 | $2,411 +1.5% | $13,438 -8.3% |
| 2011 | $2,375 -0.4% | $14,654 |
| 2010 | $2,385 +4.4% | $14,654 |
| 2009 | $2,285 -12.8% | $14,654 -19.8% |
| 2008 | $2,620 +1% | $18,265 |
| 2007 | $2,594 -1.1% | $18,265 |
| 2006 | $2,622 +51.8% | $18,265 +72.8% |
| 2005 | $1,728 +1% | $10,573 |
| 2004 | $1,710 +2.2% | $10,573 |
| 2003 | $1,673 +35.3% | $10,573 +53.6% |
| 2002 | $1,237 +47% | $6,883 |
| 2001 | $841 +32.9% | $6,883 |
| 2000 | $633 +0% | $6,883 +30% |
| 1999 | $633 | $5,296 |
Find assessor info on the county website
Monthly payment
Est. payment
Payment breakdown
Explore the cost of this home by adjusting the details. Changes won't be saved.Climate risks
Neighborhood: Englewood
Nearby schools

Similar homes
- $429,0006 bd2 ba-- sqft7340 S Yale Ave, Chicago, IL 60621New
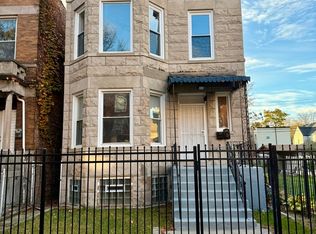 MLS ID #12808296, Behrouz Hoghoughi, Century 21 Circle. MRED as distributed by MLS GRID
- $399,0006 bd2 ba-- sqft5630 S Green St, Chicago, IL 60621New
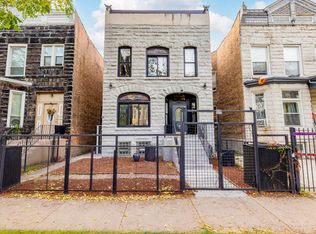 MLS ID #12805872, Robert Reyes, Realty of America, LLC. MRED as distributed by MLS GRID
- $425,0007 bd3 ba-- sqft5758 S Elizabeth St, Chicago, IL 60636New
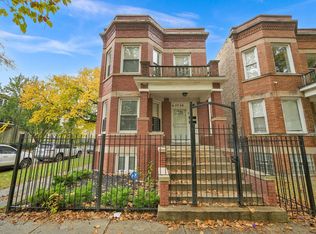 MLS ID #12801481, Daniel Bahena, HomeSmart Connect LLC. MRED as distributed by MLS GRID
- $379,9005 bd2 ba-- sqft712 W Marquette Rd, Chicago, IL 60621Active
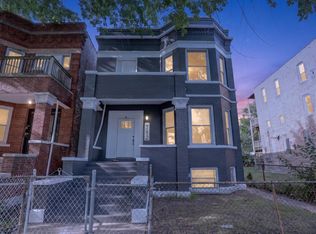 MLS ID #12804760, Rashauna Scott, Keller Williams ONEChicago. MRED as distributed by MLS GRID
