SELLER FINANCE AVAILABLE.
Brick ranch in North Baton Rouge with 3 beds, 2 baths, and 1,271 square feet on a shaded lot. Fresh neutral paint, wood look flooring, open living and dining, covered front porch. Single story, solid bones, easy access to Southern, BRCC, Airline Hwy, and I-110. Owner occupied, notice required for showings.
For sale
$199,500
6769 Juniper Dr, Baton Rouge, LA 70812
3beds
1,271sqft
Single Family Residence
Built in 1977
6,098 Square Feet Lot
$-- Zestimate®
$157/sqft
$-- HOA
What's special
Brick ranchCovered front porchShaded lotFresh neutral paintOpen living and diningWood look flooring
- 31 days
- 97
- 14
Zillow last checked:
Listing updated:
Listed by:
Teresa M Jennings,
eXp Realty, LLC 337-522-7554
Source: ROAM MLS,MLS#: 2026015053
Facts & features
Interior
Bedrooms & bathrooms
- Bedrooms: 3
- Bathrooms: 2
- Full bathrooms: 2
Primary bedroom
- Level: First
- Area: 120 Square Feet
- Dimensions: 12 x 10
Bedroom
- Level: First
- Area: 120 Square Feet
- Dimensions: 12 x 10
Bedroom
- Description: Main
- Area: 132 Square Feet
- Dimensions: 12 x 11
Kitchen
- Description: Main
- Area: 132 Square Feet
- Dimensions: 12 x 11
Heating
- Central
Cooling
- Central Air, Ceiling Fan(s)
Features
- En Suite
Interior area
- Total structure area: 1,271
- Total interior livable area: 1,271 sqft
Property
Parking
- Total spaces: 2
- Parking features: Covered
Features
- Levels: One
- Stories: 1
Lot
- Size: 6,098 Square Feet
- Dimensions: 69 x 110 x 90 x 106
Details
- Parcel number: 1402811
Construction
Type & style
- Home type: SingleFamily
- Architectural style: Traditional
- Property subtype: Single Family Residence
Materials
- Brick
- Foundation: Slab
Condition
- Year built: 1977
Utilities & green energy
- Sewer: Public Sewer
- Water: Public
Community & HOA
HOA
- Has HOA: No
Location
- Region: Baton Rouge
Financial & listing details
- Price per square foot: $157/sqft
- Tax assessed value: $161,400
- Annual tax amount: $1,205
- Date on market: 8/14/2026
- Listing terms: Conventional,FHA,USDA Loan,VA Loan
Estimated market value
Not available
Estimated sales range
Not available
Not available
Price history
| Date | Event | Price |
|---|---|---|
| 10/12/2026 | Listed for sale | $199,500-3.4%$157/sqft |
Source:  ROAM MLS #2026015053 Report a problem | ||
| 9/19/2026 | Listing removed | $206,500$162/sqft |
Source: eXp Realty #2026015053 Report a problem | ||
| 9/2/2026 | Price change | $206,500-1.2%$162/sqft |
Source: ROAM MLS #2026015053 Report a problem | ||
| 8/14/2026 | Listed for sale | $209,000+16.2%$164/sqft |
Source: ROAM MLS #2026015053 Report a problem | ||
| 6/5/2025 | Sold | -- |
Source: ROAM MLS #2025007617 Report a problem | ||
| 5/13/2025 | Pending sale | $179,900$142/sqft |
Source: ROAM MLS #2025007617 Report a problem | ||
| 4/28/2025 | Listed for sale | $179,900+5.9%$142/sqft |
Source: ROAM MLS #2025007617 Report a problem | ||
| 12/10/2024 | Sold | -- |
Source: Public Record Report a problem | ||
| 12/19/2023 | Sold | -- |
Source: ROAM MLS #2023015682 Report a problem | ||
| 9/29/2023 | Pending sale | $169,900$134/sqft |
Source: ROAM MLS #2023015682 Report a problem | ||
| 9/19/2023 | Listed for sale | $169,900-1.2%$134/sqft |
Source: ROAM MLS #2023015682 Report a problem | ||
| 9/18/2023 | Listing removed | -- |
Source: ROAM MLS #2023014033 Report a problem | ||
| 8/22/2023 | Listed for sale | $171,900+72.1%$135/sqft |
Source: ROAM MLS #2023014033 Report a problem | ||
| 9/6/2022 | Sold | -- |
Source: Public Record Report a problem | ||
| 11/10/2014 | Listing removed | $715$1/sqft |
Source: HS Property Owner, LLC Report a problem | ||
| 9/29/2014 | Listing removed | $99,900$79/sqft |
Source: Owner Report a problem | ||
| 9/29/2014 | Listed for rent | $715$1/sqft |
Source: HS Property Owner, LLC Report a problem | ||
| 8/22/2014 | Listed for sale | $99,900$79/sqft |
Source: Owner Report a problem | ||
| 7/1/2014 | Sold | -- |
Source: Public Record Report a problem | ||
| 4/9/2007 | Sold | -- |
Source: Public Record Report a problem | ||
| 2/26/1999 | Sold | -- |
Source: Public Record Report a problem | ||
| 10/9/1998 | Sold | -- |
Source: Public Record Report a problem | ||
Public tax history
| Year | Property taxes | Tax assessment |
|---|---|---|
| 2025 | $1,205 -46% | $16,140 |
| 2024 | $2,232 +625.7% | $16,140 +69.9% |
| 2023 | $308 -77.1% | $9,500 |
| 2022 | $1,343 +1.6% | $9,500 |
| 2021 | $1,322 -1% | $9,500 |
| 2020 | $1,336 -3.3% | $9,500 |
| 2019 | $1,381 +1% | $9,500 |
| 2018 | $1,367 | $9,500 |
| 2017 | $1,367 | $9,500 +51.3% |
| 2016 | $1,367 +52.6% | $6,280 -12.8% |
| 2015 | $896 -13.2% | $7,200 |
| 2014 | $1,032 | $7,200 -5.3% |
| 2013 | $1,032 -5.1% | $7,600 |
| 2012 | $1,088 -0.8% | $7,600 |
| 2011 | $1,097 +3% | $7,600 |
| 2010 | $1,065 | $7,600 +2% |
| 2006 | -- | $7,450 |
| 2005 | -- | $7,450 |
| 2004 | -- | $7,450 +6.4% |
| 2003 | -- | $7,000 |
| 2002 | -- | $7,000 |
| 2001 | -- | $7,000 |
| 2000 | -- | $7,000 |
Find assessor info on the county website
Monthly payment
Est. payment
Payment breakdown
Explore the cost of this home by adjusting the details. Changes won't be saved.Climate risks
Neighborhood: Zion City
- $132,400-- bd-- ba1.3k sqft6645 Glen Echo Dr, Baton Rouge, LA 70812Off Market
- $120,900-- bd-- ba1.1k sqft6745 Juniper Dr, Baton Rouge, LA 70812Off Market
- $139,500-- bd-- ba1.3k sqft6622 Glen Echo Dr, Baton Rouge, LA 70812Off Market
- $143,400-- bd-- ba1.4k sqft6770 Juniper Dr, Baton Rouge, LA 70812Off Market
Similar homes
- $165,0003 bd2 ba1.3k sqft6801 Oak Park Dr, Baton Rouge, LA 70812For Sale
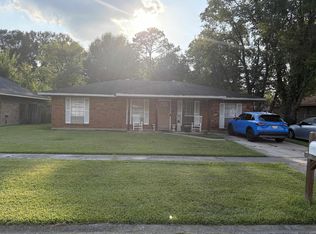
 MLS ID #2026015768, Candy Harris, Southern United Properties. ROAM MLS
- $189,0003 bd2 ba1.5k sqft7649 Governor Derbigny Dr, Baton Rouge, LA 70811For Sale
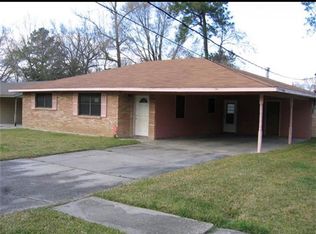 MLS ID #2565102, Tori J Garrett, BHHS- United Properties. ROAM MLS
- $165,0004 bd2 ba1.1k sqft3658 N 38th St, Baton Rouge, LA 70805For Sale
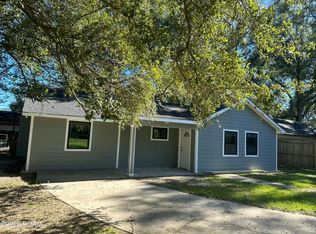 MLS ID #200SNU, Marleen A. Moss, Keller Williams Realty-First Choice. ROAM MLS
- $175,0003 bd2 ba1.4k sqft11623 Biscayne Dr, Baton Rouge, LA 70814For Sale
 MLS ID #200IJO, Danielle Story, Kaizen Home Sales and Services, LLC. ROAM MLS
- $210,0003 bd2 ba1.5k sqft10013 Santa Monica Ave, Baton Rouge, LA 70818For SaleMLS ID #2600008054, Cody Ficklen, JMG Real Estate. ROAM MLS
- $185,4003 bd2 ba1.4k sqft2720 Juban Ave, Baton Rouge, LA 70805For SaleMLS ID #2582393, Theresa J. Johns, Gulf South International, REAL. ROAM MLS
- $199,5003 bd2 ba1.5k sqft3965 Pensacola Dr, Baton Rouge, LA 70814For SaleMLS ID #2026010961, Michael Vallien, Vallien Realty LLC. ROAM MLS
- $186,0003 bd2 ba1.4k sqft11746 Biscayne Dr, Baton Rouge, LA 70814For SaleMLS ID #2026016650, Chad Sellers, Louisiana Property Shop LLC. ROAM MLS
- $209,0003 bd2 ba1.6k sqft9181 W Darryl Pkwy, Baton Rouge, LA 70815For SaleMLS ID #2026011370, Kent Charpentier, KELLER WILLIAMS REALTY BAYOU P. ROAM MLS
- $200,0004 bd2 ba1.8k sqft10124 Mollylea Dr, Baton Rouge, LA 70815For SaleMLS ID #2026009284, Kevin Doiron, Geaux Home Real Estate. ROAM MLS
- $215,0003 bd2 ba1.5k sqft3265 Charlotte Dr, Baton Rouge, LA 70814For SaleMLS ID #2025007519, Stephanie Trim, CeeGee Realty LLC. ROAM MLS
- $207,0003 bd2 ba1.6k sqft14124 Blairstown Dr, Baker, LA 70714For SaleMLS ID #2026009685, Julia Johnson, Ideal Real Estate & Property Management LLC. ROAM MLS
- $189,0004 bd2 ba1.6k sqft11555 E Black Oak Dr, Baton Rouge, LA 70815For SaleMLS ID #2026015993, Lily Ngo, Clients First Realty, LLC. ROAM MLS
- $119,9003 bd2 ba1k sqft5776 Atlanta Ave, Baton Rouge, LA 70812For SaleMLS ID #2026012479, Gaylord Bell, Lacy Baaheth, LLC. ROAM MLS
- $165,9004 bd2 ba1.7k sqft5115 Woodlawn Ave, Baton Rouge, LA 70805For SaleMLS ID #2026012614, CeeGee Hilton, CeeGee Realty LLC. ROAM MLS
- $100,0003 bd2 ba1.5k sqft8860 Sharon Hills St, Baton Rouge, LA 70811For SaleMLS ID #200EFS, Manh Nguyen, Keller Williams Realty Red Stick Partners. ROAM MLS
- $249,9003 bd2 ba1.3k sqft9479 Swingalong Ave, Baton Rouge, LA 70814For SaleMLS ID #2552640, Tamico A Casey, Keyhole Brokerage, LLC. ROAM MLS
- $209,0005 bd2 ba1.8k sqft13338 E Shamrock Ave, Baton Rouge, LA 70814For SaleMLS ID #2026012178, James Pursifull, JP RealEstate LA LLC. ROAM MLS
- $179,9004 bd2 ba1.3k sqft11325 Cypress Dale Ave, Baton Rouge, LA 70807For SaleMLS ID #2025018743, Gage Stevens, JP RealEstate LA LLC. ROAM MLS
- $168,5003 bd2 ba1.2k sqft11588 Biscayne Dr, Baton Rouge, LA 70814For SaleMLS ID #2026005784, Glenda Pollard, Pollard Partners. ROAM MLS
