Steps from Wynwood’s galleries, murals, restaurants, and weekend events, this 4-bedroom, 2-bath home puts you in the middle of Miami’s creative district with direct I-95 access for quick trips to Downtown, Midtown, the airport, and the beaches.
For sale by owner
$615,000
677 NW 45th St, Miami, FL 33127
4beds
1,472sqft
MultiFamily
Built in 1931
-- sqft lot
$-- Zestimate®
$418/sqft
$-- HOA
Overview
- 5 days
- 228
- 20
Listed by:
Property Owner (786) 848-1249
Facts & features
Interior
Bedrooms & bathrooms
- Bedrooms: 4
- Bathrooms: 2
- Full bathrooms: 2
Interior area
- Total interior livable area: 1,472 sqft
Property
Features
- Exterior features: Other
Lot
- Size: 5,488 Square Feet
Details
- Parcel number: 0131240030150
Construction
Type & style
- Home type: MultiFamily
Materials
- special
- Foundation: Other
- Roof: Other
Condition
- New construction: No
- Year built: 1931
Community & HOA
Location
- Region: Miami
Financial & listing details
- Price per square foot: $418/sqft
- Tax assessed value: $558,656
- Annual tax amount: $9,007
- Date on market: 11/16/2026
Estimated market value
Not available
Estimated sales range
Not available
$3,225/mo
Price history
| Date | Event | Price |
|---|---|---|
| 11/16/2026 | Listed for sale | $615,000-0.8%$418/sqft |
Source: Owner Report a problem | ||
| 9/9/2025 | Listing removed | -- |
Source: Owner Report a problem | ||
| 8/17/2025 | Listed for sale | $620,000$421/sqft |
Source: Owner Report a problem | ||
| 8/3/2025 | Listing removed | -- |
Source: Owner Report a problem | ||
| 4/28/2025 | Listed for sale | $620,000$421/sqft |
Source: Owner Report a problem | ||
Public tax history
| Year | Property taxes | Tax assessment |
|---|---|---|
| 2025 | $9,007 +22.9% | $340,061 +10% |
| 2024 | $7,330 +3.1% | $309,147 +10% |
| 2023 | $7,107 +5.2% | $281,043 +10% |
| 2022 | $6,756 +12.6% | $255,494 +10% |
| 2021 | $5,998 +5.1% | $232,268 +10% |
| 2020 | $5,708 +17.5% | $211,153 +10% |
| 2019 | $4,858 -0.1% | $191,958 -0.2% |
| 2018 | $4,860 | $192,338 +10% |
| 2017 | $4,860 +8.8% | $174,853 +10% |
| 2016 | $4,468 +7.1% | $158,958 +3.6% |
| 2015 | $4,172 +165.7% | $153,458 +49.1% |
| 2014 | $1,570 +8.8% | $102,893 +8.9% |
| 2013 | $1,443 | $94,514 -6.9% |
| 2012 | $1,443 -16.5% | $101,564 -9.4% |
| 2010 | $1,729 -10.9% | $112,082 -9.6% |
| 2009 | $1,940 -14.2% | $124,018 +136.9% |
| 2007 | $2,261 +2.6% | $52,355 |
| 2006 | $2,204 | -- |
| 2005 | $2,204 +48.8% | -- |
| 2004 | $1,481 +34.4% | -- |
| 2003 | $1,102 +7.8% | -- |
| 2002 | $1,022 | -- |
| 2001 | $1,022 | -- |
Find assessor info on the county website
Monthly payment
Est. payment
Payment breakdown
Explore the cost of this home by adjusting the details. Changes won't be saved.Climate risks
Neighborhood: Little Haiti


Similar homes
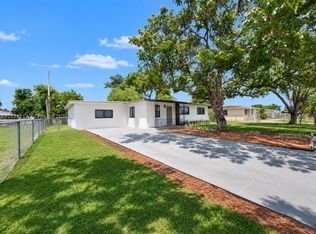
- $599,8005 bd2 ba1.6k sqftAnderson Heights, Miami, FL 33147For Sale
 MLS ID #A12127212, Michael Bustillo, Primus Real Estate LLC. MIAMI
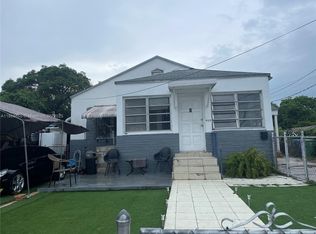
- $639,0003 bd2 ba1.6k sqftHarwood 2nd Addn To River, Miami, FL 33125For Sale
 MLS ID #A11866655, Gelsis Navarro, One Stop Realty. MIAMI
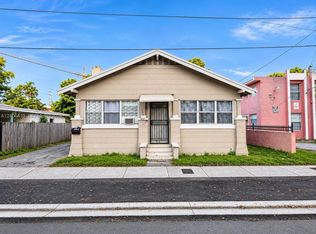
- $570,0007 bd3 ba2.1k sqftLittle River Gardens Amd, Miami, FL 33138For Sale
 MLS ID #A12106419, Jaime Velasquez, London Foster Realty. MIAMI
- $575,0003 bd2 ba1.2k sqft7041 NW 6TH Avenue, Miami, FL 33150For Sale

 MLS ID #B26073412, Wilhelmine Carby, Grande Ocean Realty. BeachesMLS
- $610,0003 bd2 ba1.5k sqftPark View Sub, Miami, FL 33167For SaleMLS ID #A12121825, Evens Montes De Oca Gende, United Realty Group Inc. MIAMI
- $620,0003 bd1 ba1.3k sqftChurchill Estates, Miami, FL 33126For SaleMLS ID #A12106749, Olga Dreke, OD Realty Group Corp.. MIAMI
- $598,0006 bd3 ba1.8k sqftKirkland Heights Amd, Miami, FL 33135For SaleMLS ID #A12016616, Javier Fano Villaescusa, Legacy Realty Partners, LLC.. MIAMI
- $590,0003 bd1 ba1.3k sqftIndian Mound Park, Miami, FL 33138For SaleMLS ID #A12100540, Allen-Michael Screen, Screen Realty. MIAMI
- $489,9992 bd1 ba1.2k sqftSanta Clara Sub, Miami, FL 33127For SaleMLS ID #A11949489, Takasha Flowers, Dalton Wade Inc. MIAMI
- $615,0004 bd2 ba1.6k sqftCastle Estates, Hialeah, FL 33012For SaleMLS ID #A12078563, Jorge Mirabal, J. Mirabal Realty, Inc.. MIAMI
- $595,0006 bd4 ba1.7k sqftStephen Manor, Miami, FL 33150For SaleMLS ID #A12035975, Lorenzo Ramos, Coldwell Banker Realty. MIAMI
- $795,0003 bd2 ba1.4k sqftWest Flagler Center Le Je, Miami, FL 33134For SaleMLS ID #A12125239, Anthony Auletta, Florida Realty of Miami Corp. MIAMI
- $530,0005 bd3 ba1.7k sqftWoodland Addn, Miami, FL 33147For SaleMLS ID #A12117997, Brandon Jean Baptiste, The Keyes Company. MIAMI
- $529,9003 bd2 ba1.7k sqftGrapeland Heights Sec 2, Miami, FL 33125For SaleMLS ID #A12079145, Dionisio Torres, Luxe Properties. MIAMI
- $530,0004 bd2 ba1.4k sqftJoy Homes, Miami, FL 33147For SaleMLS ID #A12046646, Omar Elsehrawy, One Sotheby's International Realty. MIAMI
- $599,9994 bd3 ba1.7k sqftThe Tropics Amd, Miami, FL 33147For SaleMLS ID #A12077198, Raymi Nodarse Valdes, Real Estate Craft, LLC.. MIAMI
- $600,0006 bd4 ba1.8k sqftGlenwood Heights Addn, Miami, FL 33142For SaleMLS ID #A12002968, Jairo Lemos, United Realty Group, Inc. MIAMI
- $640,0004 bd2 ba1.5k sqftLinden Gardens, Hialeah, FL 33013For SaleMLS ID #A11837282, Miriam Hernandez, Capstone Realtors Corp. MIAMI
- $435,0003 bd2 ba1.8k sqftThe Tropics Amd, Miami, FL 33147For SaleMLS ID #A12125356, Robert Henry, Charles Rutenberg Realty FTL. MIAMI
