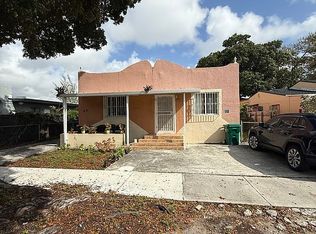
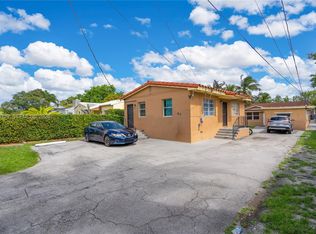
Prime T5-O redevelopment opportunity in Miami’s Little River area! Situated on an approximately 7,250 SF lot, this income-producing duplex, offering cash flow while a buyer explores the property’s future development potential with a perfect example right across the street. T5-O zoning allows for multifamily and mixed-use possibilities, with significant redevelopment activity already occurring along the immediate NE 1st Ave corridor. Property consists of a main residence plus a detached CBS rear unit. Excellent opportunity for a developer, builder or investor seeking covered land in a rapidly evolving Miami location. Buyer to independently verify zoning, permitted uses, density, measurements and development feasibility with the City of Miami.
Accepting backups
$570,000
8111 NE 1st Ave, Miami, FL 33138
7beds
3baths
2,176sqft
Duplex
Built in 1921
-- sqft lot
$-- Zestimate®
$262/sqft
$-- HOA
What's special
- 4 days
- 47
- 3
Likely to sell faster than
Zillow last checked:
Listing updated:
Listed by:
Jaime Velasquez 786-797-7886,
London Foster Realty
Source: MIAMI,MLS#: A12106419 Originating MLS: A-Miami Association of REALTORS
Facts & features
Interior
Bedrooms & bathrooms
- Bedrooms: 7
- Bathrooms: 3
Heating
- None
Cooling
- Ceiling Fan(s), Central Air, Wall/Window Unit(s)
Features
- Flooring: Other
Interior area
- Total structure area: 2,216
- Total interior livable area: 2,176 sqft
Property
Parking
- Total spaces: 2
Features
- Stories: 1
Lot
- Features: Less Than 1/4 Acre Lot
Details
- Parcel number: 0131120120120
- Zoning: 6101
Construction
Type & style
- Home type: MultiFamily
- Property subtype: Duplex
Materials
- CBS Construction, Frame With Stucco
- Roof: Shingle
Condition
- Year built: 1921
Utilities & green energy
- Sewer: Public Sewer
Community & HOA
Community
- Subdivision: Little River Gardens Amd
HOA
- Has HOA: No
Location
- Region: Miami
Financial & listing details
- Price per square foot: $262/sqft
- Tax assessed value: $519,961
- Annual tax amount: $7,650
- Date on market: 11/12/2026
- Listing terms: All Cash,Conventional,1031 Exchange
Estimated market value
Not available
Estimated sales range
Not available
Not available
Price history
| Date | Event | Price |
|---|---|---|
| 11/12/2026 | Listed for sale | $570,000-4.8%$262/sqft |
Source:  MIAMI #A12106419 Report a problem | ||
| 8/19/2026 | Listing removed | $599,000$275/sqft |
Source:  BeachesMLS #R11155403 Report a problem | ||
| 8/5/2026 | Price change | $599,000-7.8%$275/sqft |
Source: BeachesMLS #R11155403 Report a problem | ||
| 6/11/2026 | Price change | $650,000-5.5%$299/sqft |
Source: BeachesMLS #R11155403 Report a problem | ||
| 4/22/2026 | Price change | $688,000-0.1%$316/sqft |
Source: BeachesMLS #R11155403 Report a problem | ||
| 4/10/2026 | Price change | $689,000-1.4%$317/sqft |
Source: BeachesMLS #R11155403 Report a problem | ||
| 3/10/2026 | Price change | $699,000-3.6%$321/sqft |
Source: BeachesMLS #R11155403 Report a problem | ||
| 1/18/2026 | Listed for sale | $725,000+530.4%$333/sqft |
Source: BeachesMLS #RX-11155403 Report a problem | ||
| 4/24/2015 | Sold | $115,000-4.2%$53/sqft |
Source: Public Record Report a problem | ||
| 10/24/2014 | Listed for sale | $120,000-30.2%$55/sqft |
Source: Cervera Real Estate Inc. #A1926147 Report a problem | ||
| 3/27/2014 | Listed for sale | $172,000+27.4%$79/sqft |
Source: Cervera Real Estate Inc. #A1926147 Report a problem | ||
| 3/28/2005 | Sold | $135,000+255.3%$62/sqft |
Source: Public Record Report a problem | ||
| 11/29/2001 | Sold | $38,000-49.3%$17/sqft |
Source: Public Record Report a problem | ||
| 8/18/1999 | Sold | $75,000+233.3%$34/sqft |
Source: Public Record Report a problem | ||
| 5/10/1999 | Sold | $22,500$10/sqft |
Source: Public Record Report a problem | ||
Public tax history
| Year | Property taxes | Tax assessment |
|---|---|---|
| 2025 | $7,651 +3.8% | $229,251 +10% |
| 2024 | $7,373 +1.7% | $208,410 +10% |
| 2023 | $7,252 +25.2% | $189,464 +10% |
| 2022 | $5,792 +23.1% | $172,240 +25.5% |
| 2021 | $4,707 +3.5% | $137,226 +10% |
| 2020 | $4,548 +10% | $124,751 +10% |
| 2019 | $4,136 +14.3% | $113,410 +10% |
| 2018 | $3,618 | $103,100 +10% |
| 2017 | $3,618 +12.4% | $93,728 +10% |
| 2016 | $3,218 +27.1% | $85,208 +36.2% |
| 2015 | $2,531 -6.5% | $62,580 -9.4% |
| 2014 | $2,707 -21% | $69,093 0% |
| 2013 | $3,427 | $69,104 -31.7% |
| 2012 | $3,427 -5.1% | $101,219 -6.8% |
| 2011 | $3,611 -19.3% | $108,610 -21.1% |
| 2010 | $4,472 -5% | $137,621 -9.2% |
| 2009 | $4,707 +14.1% | $151,525 +6.5% |
| 2007 | $4,127 +31.3% | $142,260 |
| 2006 | $3,142 | -- |
| 2005 | $3,142 +8.8% | -- |
| 2004 | $2,889 +27.5% | -- |
| 2003 | $2,265 -11.6% | -- |
| 2001 | $2,561 | -- |
Find assessor info on the county website
Monthly payment
Est. payment
Payment breakdown
Explore the cost of this home by adjusting the details. Changes won't be saved.Climate risks
Neighborhood: Little Haiti


Similar homes
- $615,0004 bd2 ba1.4k sqft677 NW 45th St, Miami, FL 33127For Sale By Owner
- $615,0006 bd2 ba1.2k sqft7700 NE 1st Court, Miami, FL 33138For Sale

 MLS ID #B26016712, Alex Simpson, LoKation. BeachesMLS
- $674,9996 bd3 ba1.9k sqftFairway, Miami, FL 33150For Sale
 MLS ID #A12023339, Wesly Blanc, Lifestyle International Realty. MIAMI
- $595,0006 bd4 ba1.7k sqftStephen Manor, Miami, FL 33150For Sale
 MLS ID #A12035975, Lorenzo Ramos, Coldwell Banker Realty. MIAMI
- $598,0006 bd3 ba1.8k sqftKirkland Heights Amd, Miami, FL 33135For SaleMLS ID #A12016616, Javier Fano Villaescusa, Legacy Realty Partners, LLC.. MIAMI
- $550,0005 bd3 ba2k sqft10400 NW 22ND Avenue, Miami, FL 33147For SaleMLS ID #B26094391, Frantzcito Jean Pierre, LYNQ Real Estate. BeachesMLS
- $555,0005 bd4 ba1.6k sqftAvocado Park, Miami, FL 33147For SaleMLS ID #A12113148, Natalia Haseitel, Coldwell Banker Realty. MIAMI
- $695,0004 bd3 ba1.6k sqft154 NW 67TH Street, Miami, FL 33150For SaleMLS ID #B26091320, Monica Rea, Align Right Realty K1 Group. BeachesMLS
- $500,0004 bd2 ba1.4k sqftWest End Park Amd Pl, Miami, FL 33142For SaleMLS ID #A12117538, Mario Cabrera Benjamin Jr, Chez Realty, LLC.. MIAMI
- $635,0005 bd3 ba2.2k sqft22nd Ave Heights, Miami, FL 33147For SaleMLS ID #A12078875, Sebastian Ramirez PA, Florida Realty Agency. MIAMI
- $775,0005 bd4 ba2.1k sqftAvocado Park, Miami, FL 33147For SaleMLS ID #A12116524, Marcelo Melnitzky, Terrabella Realty. MIAMI
- $504,0004 bd2 ba1.1k sqftSeventh Ave Park, Miami, FL 33150For SaleMLS ID #A12104034, Michael Lavernia, Luxe Properties. MIAMI
- $599,9994 bd3 ba1.7k sqftThe Tropics Amd, Miami, FL 33147For SaleMLS ID #A12077198, Raymi Nodarse Valdes, Real Estate Craft, LLC.. MIAMI
- $530,0004 bd2 ba1.3k sqft1st Addn Pinewood Pk, Miami, FL 33150For SaleMLS ID #A12060233, Maria Somarriba, The Lab Realty Group, LLC. MIAMI
- $530,0004 bd2 ba1.4k sqftJoy Homes, Miami, FL 33147For SaleMLS ID #A12046646, Omar Elsehrawy, One Sotheby's International Realty. MIAMI
- $555,0006 bd3 ba2.1k sqft2815 ADAMS Street, Hollywood, FL 33020For SaleMLS ID #B26059999, Amy Berman, The Keyes Company. BeachesMLS
- $625,0005 bd3 ba2.5k sqft2327 POLK Street #A-B, Hollywood, FL 33020For SaleMLS ID #B26089748, Richard M DiPietro, Real Broker, LLC. BeachesMLS
- $559,9994 bd2 ba1.6k sqftSaratoga Heights Re-Sub, Hialeah, FL 33013For SaleMLS ID #A12087082, Gelien Perez, Elite Pro Realty, LLC.. MIAMI
- $709,0007 bd3 ba1.8k sqftBiscayne Village Heights, North Miami, FL 33168For SaleMLS ID #A12051618, Alex Acker, Coldwell Banker Realty. MIAMI
- $620,0004 bd4 ba2.3k sqft2907 SW 67TH Terrace, Miramar, FL 33023For SaleMLS ID #B26062652, Rose B Thompson, High Equity Realty, Inc.. BeachesMLS
