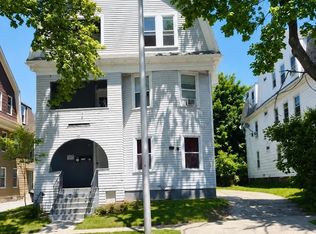
$703,400
9 bd|3 ba|4.3k sqft
67 Oread St, Worcester, MA 01608
Off Market
Zillow last checked:
Listing updated:
Salustia Ortiz 508-369-6462,
Dreamcatcher Investment Group, Inc. 617-561-1040
$762,000
$693,000 - $831,000
$2,767/mo
| Date | Event | Price |
|---|---|---|
| 5/30/2026 | Pending sale | $875,000$182/sqft |
Source: MLS PIN #73411492 Report a problem | ||
| 8/5/2025 | Contingent | $875,000$182/sqft |
Source: MLS PIN #73411492 Report a problem | ||
| 7/30/2025 | Listed for sale | $875,000+98.9%$182/sqft |
Source: MLS PIN #73411492 Report a problem | ||
| 8/25/2021 | Sold | $440,000+49.7%$92/sqft |
Source: Public Record Report a problem | ||
| 2/6/2019 | Sold | $294,000+75.1%$61/sqft |
Source: Public Record Report a problem | ||
| 5/31/2017 | Sold | $167,900+7.7%$35/sqft |
Source: Public Record Report a problem | ||
| 2/10/2017 | Listing removed | $155,900$32/sqft |
Source: Dreamcatcher Investment Group, Inc. #72084612 Report a problem | ||
| 1/27/2017 | Pending sale | $155,900$32/sqft |
Source: Dreamcatcher Investment Group, Inc. #72084612 Report a problem | ||
| 10/21/2016 | Listed for sale | $155,900-47.2%$32/sqft |
Source: Dreamcatcher Investment Group, Inc. #72084612 Report a problem | ||
| 12/29/2005 | Sold | $295,000+5775.3%$61/sqft |
Source: Public Record Report a problem | ||
| 7/20/1995 | Sold | $5,021-96%$1/sqft |
Source: Public Record Report a problem | ||
| 4/6/1994 | Sold | $124,571+3.9%$26/sqft |
Source: Public Record Report a problem | ||
| 3/14/1989 | Sold | $119,900$25/sqft |
Source: Public Record Report a problem | ||
| Year | Property taxes | Tax assessment |
|---|---|---|
| 2025 | $8,362 +9% | $634,000 +13.6% |
| 2024 | $7,674 +5.3% | $558,100 +9.8% |
| 2023 | $7,289 +15% | $508,300 +21.9% |
| 2022 | $6,341 +11.6% | $416,900 +19.4% |
| 2021 | $5,683 +8.7% | $349,100 +13.5% |
| 2020 | $5,229 +44.6% | $307,600 +53.1% |
| 2019 | $3,616 +2.1% | $200,900 +7.3% |
| 2018 | $3,542 +6.5% | $187,300 +8.2% |
| 2017 | $3,327 +3.7% | $173,100 +11.2% |
| 2016 | $3,207 +2.7% | $155,600 |
| 2015 | $3,123 +2.7% | $155,600 |
| 2014 | $3,040 +0.9% | $155,600 -4.1% |
| 2013 | $3,014 +5.3% | $162,200 -3.7% |
| 2012 | $2,861 -22.3% | $168,500 -30.7% |
| 2010 | $3,681 -1.1% | $243,000 -11.9% |
| 2009 | $3,722 -11.2% | $275,700 -17.5% |
| 2008 | $4,190 +9.3% | $334,100 +5.5% |
| 2007 | $3,832 +14.4% | $316,700 +18.5% |
| 2006 | $3,349 +2.5% | $267,300 +7.8% |
| 2005 | $3,267 +41.2% | $247,900 +58% |
| 2004 | $2,314 +11.1% | $156,900 +21.7% |
| 2003 | $2,083 +293% | $128,900 +334% |
| 2002 | $530 | $29,700 +3.5% |
| 2000 | $530 -14.2% | $28,700 -13.3% |
| 1997 | $618 | $33,100 |
Find assessor info on the county website
A local agent can set up tours, give advice and negotiate with sellers.
A local lender can help you make sure your offer is ready when you are.