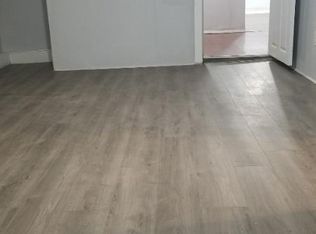
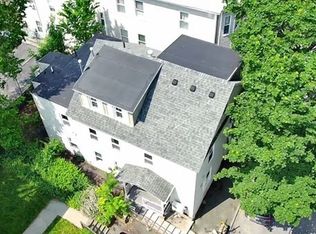
Excellent opportunity to own a spacious multi-family property in a convenient Worcester location. This well-positioned property offers Three units with strong rental income potential and easy access to hospitals, schools, shopping, restaurants, public transportation, and major routes. Property features separate utilities, ample living space, and strong upside for investors or owner occupants alike. Located minutes from downtown Worcester, Union Station, UMass Memorial Medical Center, and local universities. Great opportunity to build equity and add value in one of Central Massachusetts’ growing rental marketsopen house Sunday 2-3:30 pm. (05/17/2026)
Pending
$510,000
7 Liberty St, Worcester, MA 01605
6beds
2,481sqft
3 Family
Built in 1890
-- sqft lot
$510,200 Zestimate®
$206/sqft
$-- HOA
What's special
- 42 days |
- 75 |
- 7 |
Zillow last checked:
Listing updated:
Listed by:
Tai Cheng 781-308-9390,
La Maison 508-736-2911,
Tai Cheng 781-308-9390
Source: MLS PIN,MLS#: 73519060
Facts & features
Interior
Bedrooms & bathrooms
- Bedrooms: 6
- Bathrooms: 3
- Full bathrooms: 3
Features
- Has basement: No
- Has fireplace: No
Interior area
- Total structure area: 2,481
- Total interior livable area: 2,481 sqft
- Finished area above ground: 2,481
Property
Parking
- Total spaces: 2
- Uncovered spaces: 2
Lot
- Size: 2,967 Square Feet
- Features: Corner Lot
Details
- Parcel number: M:01 B:025 L:00006,1762300
- Zoning: RG-5
Construction
Type & style
- Home type: MultiFamily
- Property subtype: 3 Family
Materials
- Foundation: Other
Condition
- Year built: 1890
Utilities & green energy
- Sewer: Public Sewer
- Water: Public
Community & HOA
Location
- Region: Worcester
Financial & listing details
- Price per square foot: $206/sqft
- Tax assessed value: $420,600
- Annual tax amount: $5,548
- Date on market: 5/16/2026
- Total actual rent: 4600
Estimated market value
$510,200
$485,000 - $536,000
$1,903/mo
Price history
| Date | Event | Price |
|---|---|---|
| 6/13/2026 | Pending sale | $510,000$206/sqft |
Source: MLS PIN #73519060 Report a problem | ||
| 5/30/2026 | Contingent | $510,000$206/sqft |
Source: MLS PIN #73519060 Report a problem | ||
| 5/14/2026 | Listed for sale | $510,000+112.5%$206/sqft |
Source: MLS PIN #73519060 Report a problem | ||
| 11/30/2020 | Sold | $240,000+757.1%$97/sqft |
Source: Public Record Report a problem | ||
| 8/23/2011 | Sold | $28,000-15.2%$11/sqft |
Source: Public Record Report a problem | ||
| 4/1/2011 | Price change | $33,000-10.8%$13/sqft |
Source: Jason Bibeau #71196271 Report a problem | ||
| 3/3/2011 | Listed for sale | $37,000-17.8%$15/sqft |
Source: foreclosure.com Report a problem | ||
| 2/22/2011 | Sold | $45,000+15.7%$18/sqft |
Source: Public Record Report a problem | ||
| 11/16/2010 | Listed for sale | $38,888-44.4%$16/sqft |
Source: Marissa Truong #71162353 Report a problem | ||
| 11/12/1999 | Sold | $69,900+86.4%$28/sqft |
Source: Public Record Report a problem | ||
| 4/29/1999 | Sold | $37,500$15/sqft |
Source: Public Record Report a problem | ||
Public tax history
| Year | Property taxes | Tax assessment |
|---|---|---|
| 2025 | $5,548 +2.9% | $420,600 +7.2% |
| 2024 | $5,394 +8% | $392,300 +12.6% |
| 2023 | $4,996 +11% | $348,400 +17.7% |
| 2022 | $4,502 +23.3% | $296,000 +32% |
| 2021 | $3,650 +7.1% | $224,200 +11.8% |
| 2020 | $3,409 +4.2% | $200,500 +10.3% |
| 2019 | $3,272 +28.4% | $181,800 +34.9% |
| 2018 | $2,549 +5.3% | $134,800 +7.1% |
| 2017 | $2,420 +2.5% | $125,900 +9.9% |
| 2016 | $2,362 -1.3% | $114,600 -3.9% |
| 2015 | $2,392 +2.7% | $119,200 |
| 2014 | $2,329 +5% | $119,200 -0.2% |
| 2013 | $2,218 +7% | $119,400 -2.1% |
| 2012 | $2,072 -21.2% | $122,000 -29.7% |
| 2010 | $2,630 +9.9% | $173,600 -2.1% |
| 2009 | $2,394 -22.8% | $177,300 -28.3% |
| 2008 | $3,101 +6.6% | $247,300 +2.9% |
| 2007 | $2,909 +5.2% | $240,400 +9% |
| 2006 | $2,764 +10.3% | $220,600 +16% |
| 2005 | $2,507 +26.1% | $190,200 +41.1% |
| 2004 | $1,988 +29.9% | $134,800 +42.3% |
| 2003 | $1,530 +7.3% | $94,700 +18.5% |
| 2002 | $1,426 +12.9% | $79,900 +16.8% |
| 2000 | $1,263 | $68,400 |
Find assessor info on the county website
Monthly payment
Est. payment$--/mo
Payment breakdown
Explore the cost of this home by adjusting the details. Changes won't be saved.All calculations are estimates and provided by Zillow, Inc. for informational purposes only. Actual amounts may vary.
HOA fees may include property taxes on listings classified as Co-Ops. Contact the listing agent and/or owner for fee details.
Mortgage interest rates are dependent on a number of factors, including credit score, down payment, and repayment length. Interest rate data provided by Zillow Group Marketplace, Inc. as of 1/1/1970 from various mortgage lenders with which we have lead or other similar arrangements; the Estimated Payment is an average of those rates.
See how much you could borrow to make a competitive offer.
Climate risks
Neighborhood: 01605
Nearby schools
GreatSchools rating
- 6/10Belmont Street Community SchoolGrades: PK-6Distance: 0.3 mi
- 4/10Worcester East Middle SchoolGrades: 7-8Distance: 1.4 mi
- 1/10North High SchoolGrades: 9-12Distance: 1.6 mi
A local agent can set up tours, give advice and negotiate with sellers.
A local lender can help you make sure your offer is ready when you are.


- Massachusetts
- Worcester County
- Worcester
- 01605
- 7 Liberty St
Nearby cities
Nearby zip codes
Other Worcester Topics
