Investors take note - Large 3 Family on an oversized lot. Tons of potential, great location close to all amenities, train station and major highways. Also included is a huge 1400 sq. ft. masonry garage. Being sold "As-Is" will need some work but well worth the effort. Cash or Private lender.
Active
$425,000
71 S Bend St, Pawtucket, RI 02860
5beds
3,305sqft
Multi Family
Built in 1900
-- sqft lot
$418,600 Zestimate®
$129/sqft
$-- HOA
What's special
Oversized lot
- 23 days
- 1,122
- 81
Likely to sell faster than
Zillow last checked:
Listing updated:
Listed by:
Melissa Perrille 401-225-9524,
eXp Realty LLC,
Michael Veltri 401-465-3727,
eXp Realty LLC
Source: StateWide MLS RI,MLS#: 1426005
Facts & features
Interior
Bedrooms & bathrooms
- Bedrooms: 5
- Bathrooms: 3
- Full bathrooms: 3
Heating
- Oil, Baseboard, Steam
Cooling
- None
Appliances
- Included: Electric Water Heater
Features
- Flooring: Ceramic Tile, Hardwood, Laminate, Other
- Basement: Full,Interior Entry,Unfinished
- Has fireplace: No
Interior area
- Total structure area: 3,305
- Total interior livable area: 3,305 sqft
Property
Parking
- Total spaces: 11
- Parking features: Detached
- Garage spaces: 5
Lot
- Size: 6,542 Square Feet
Details
- Parcel number: PAWTM24L0301
Construction
Type & style
- Home type: MultiFamily
- Property subtype: Multi Family
- Attached to another structure: Yes
Materials
- Vinyl Siding
Condition
- New construction: No
- Year built: 1900
Utilities & green energy
- Electric: 100 Amp Service, Circuit Breakers
- Utilities for property: Sewer Connected, Water Connected
Community & HOA
Community
- Subdivision: Quality Hill
HOA
- Has HOA: No
Location
- Region: Pawtucket
Financial & listing details
- Price per square foot: $129/sqft
- Tax assessed value: $480,900
- Annual tax amount: $6,324
- Date on market: 10/26/2026
- Inclusions: Seller is requesting a 90 day use & occupancy from time of sale. **Being sold "As-Is" condition. **Buyer to assume all violations / open permits
- Total actual rent: 0
- Tenant pays: Heat
Estimated market value
$418,600
$398,000 - $440,000
$2,477/mo
Price history
| Date | Event | Price |
|---|---|---|
| 10/26/2026 | Listed for sale | $425,000-22.7%$129/sqft |
Source:  StateWide MLS RI #1426005 Report a problem | ||
| 7/23/2026 | Listing removed | $550,000$166/sqft |
Source: eXp Realty #1416049 Report a problem | ||
| 6/24/2026 | Listed for sale | $550,000+900%$166/sqft |
Source: StateWide MLS RI #1416049 Report a problem | ||
| 4/25/2016 | Listing removed | $55,000$17/sqft |
Source: World Net Real Estate Group #1122869 Report a problem | ||
| 4/25/2016 | Pending sale | $55,000$17/sqft |
Source: World Net Real Estate Group #1122869 Report a problem | ||
| 4/18/2016 | Listed for sale | $55,000$17/sqft |
Source: World Net Real Estate Group #1122869 Report a problem | ||
| 4/18/2016 | Pending sale | $55,000$17/sqft |
Source: World Net Real Estate Group #1122869 Report a problem | ||
| 4/13/2016 | Listed for sale | $55,000$17/sqft |
Source: World Net Real Estate Group #1122869 Report a problem | ||
Public tax history
| Year | Property taxes | Tax assessment |
|---|---|---|
| 2025 | $5,934 | $480,900 |
| 2024 | $5,934 +1.7% | $480,900 +36.7% |
| 2023 | $5,833 | $351,800 |
| 2022 | $5,833 | $351,800 |
| 2021 | $5,833 +24.7% | $351,800 +57.1% |
| 2020 | $4,679 | $224,000 |
| 2019 | $4,679 +3.8% | $224,000 |
| 2018 | $4,509 -3.6% | $224,000 +8.8% |
| 2017 | $4,676 +3.8% | $205,800 |
| 2016 | $4,505 | $205,800 |
| 2015 | $4,505 +23.8% | $205,800 +30.4% |
| 2014 | $3,639 | $157,800 |
| 2013 | $3,639 | $157,800 +900% |
| 2012 | $3,639 -10.8% | $15,780 -93.1% |
| 2011 | $4,081 | $229,500 |
| 2010 | $4,081 | $229,500 |
| 2009 | $4,081 -9% | $229,500 -36.6% |
| 2008 | $4,486 +4.4% | $362,100 |
| 2007 | $4,295 +30.3% | $362,100 +96.8% |
| 2005 | $3,295 +3.8% | $184,000 |
| 2004 | $3,174 +4% | $184,000 |
| 2003 | $3,053 | $184,000 |
Find assessor info on the county website
Monthly payment
Est. payment
Payment breakdown
Explore the cost of this home by adjusting the details. Changes won't be saved.Climate risks
Neighborhood: Quality Hill


Similar homes
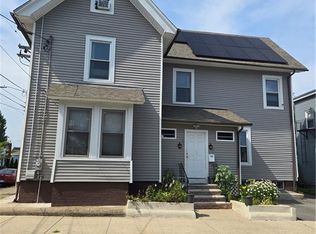
- $424,9005 bd2 ba1.8k sqft82 Jefferson Ave, Pawtucket, RI 02860For Sale

 MLS ID #1414560, Robin Pastore, CENTURY 21 Gonsalves - Pastore. StateWide MLS RI
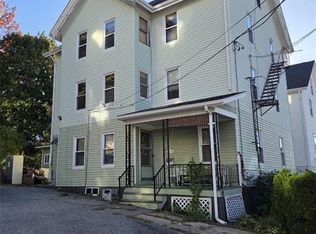
- $499,9006 bd3 ba3.1k sqft45 Harrison St, Pawtucket, RI 02860For Sale
 MLS ID #1420986, Betsey DaSilva, Noel Realty Company. StateWide MLS RI
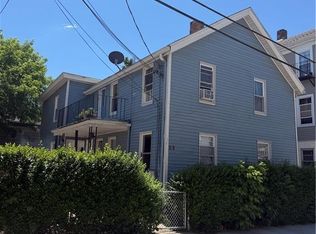
- $529,9008 bd3 ba3.2k sqft28 Chestnut St, Central Falls, RI 02863For Sale
 MLS ID #1428253, Carole McKeon, Real Broker, LLC. StateWide MLS RI
- $475,0005 bd2 ba1.8k sqft72 Sylvian St, Central Falls, RI 02863New Construction
 MLS ID #1426551, Helene Dominguez, D'Empire Real Estate LLC. StateWide MLS RI
- $489,9004 bd2 ba1.7k sqft33 Winthrop Ave, Pawtucket, RI 02861For SaleMLS ID #1424798, Sean Hevenor, RI Real Estate Services. StateWide MLS RI
- $550,0006 bd2 ba2k sqft206 Webster St, Pawtucket, RI 02861For SaleMLS ID #1428115, The SoldWithSoko Team, HERE Realty. StateWide MLS RI
- $399,0005 bd2 ba1.8k sqft38 Littlefield St, Pawtucket, RI 02861For SaleMLS ID #1415716, Frank Moreau, MGM Realty Corporation. StateWide MLS RI
- $425,0005 bd3 ba1.9k sqft68 Anthony Ave, Providence, RI 02909For SaleMLS ID #1428583, Antoanet Sialer, Prime Time Properties, Inc.. StateWide MLS RI
- $449,0005 bd2 ba2.4k sqft50 Ada St, Providence, RI 02909For SaleMLS ID #1428552, Trinity Greene, Smith and Oak Real Estate Co.. StateWide MLS RI
- $580,0004 bd3 ba2.4k sqft95 Thomas Ave, Pawtucket, RI 02860For SaleMLS ID #1424892, Augusta Fantasia, Century 21 Limitless. StateWide MLS RI
- $477,0006 bd3 ba2.8k sqft28 Armington Ave, Providence, RI 02908For SaleMLS ID #1428478, Kyle Seyboth, Century 21 Limitless. StateWide MLS RI
- $580,0004 bd2 ba2k sqft127 Robinson Ave, Pawtucket, RI 02861For SaleMLS ID #1427710, Brenda L. Marchwicki, BisMarc Properties, LLC. StateWide MLS RI
- $475,0006 bd3 ba1.9k sqft2 Young Ave, Providence, RI 02908For SaleMLS ID #1428165, Kyle Seyboth, Century 21 Limitless. StateWide MLS RI
- $445,0003 bd4 ba2.2k sqft67 Alaska St, Providence, RI 02904For SaleMLS ID #1427485, Rafael Delacruz, Bani Properties. StateWide MLS RI
- $425,0004 bd2 ba3.4k sqft56 Armington Ave, Providence, RI 02908For SaleMLS ID #1428047, The Realpro Group, REALPRO by The Water. StateWide MLS RI
- $399,9004 bd3 ba2k sqft52 Cactus St, Providence, RI 02905For SaleMLS ID #1428589, Masiell Luna, My Dream Home Realty. StateWide MLS RI
- $490,0007 bd3 ba1.8k sqft373 Cowden St, Central Falls, RI 02863For SaleMLS ID #1423046, Yamileth Sosa Ruiz, D'Empire Real Estate LLC. StateWide MLS RI
- $450,0005 bd2 ba2.3k sqft11 Grand View St, Providence, RI 02906For SaleMLS ID #1423920, Daniel Flynn, Keller Williams Leading Edge. StateWide MLS RI
- $479,9004 bd2 ba1.7k sqft21 Denison St, Providence, RI 02904For SaleMLS ID #1426941, Doug Jeffrey, Broadway Real Estate Group. StateWide MLS RI
- $359,9003 bd1 ba1.9k sqft151 Sherman St, Pawtucket, RI 02860For SaleMLS ID #1426195, Chrissy Laurendeau, Lamacchia Realty, Inc. StateWide MLS RI
