$--
4 bd|1 ba|1.1k sqft
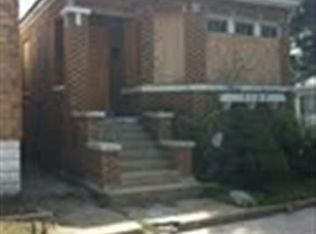
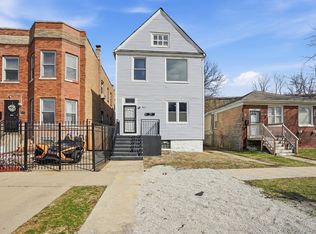
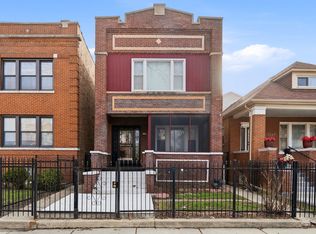
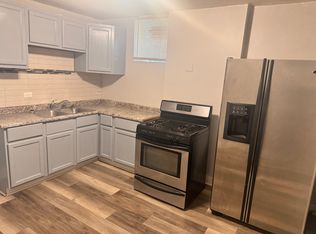
7123 S Green St #2, Chicago, IL 60621
Off Market
Zillow last checked:
Emeka Ohama 312-312-8166,
HomeSmart Connect LLC
Not available
Estimated sales range
Not available
Not available
| Date | Event | Price |
|---|---|---|
| 6/23/2025 | Listing removed | $239,900 |
Source: | ||
| 5/22/2025 | Price change | $239,900-2% |
Source: | ||
| 4/25/2025 | Listed for sale | $244,900-2% |
Source: | ||
| 10/31/2024 | Listing removed | $249,900 |
Source: | ||
| 9/15/2024 | Price change | $249,900-7.4% |
Source: | ||
| 8/29/2024 | Listed for sale | $269,900+69.7% |
Source: | ||
| 5/12/2021 | Sold | $159,000 |
Source: | ||
| 3/26/2021 | Contingent | $159,000 |
Source: | ||
| 3/12/2021 | Listed for sale | $159,000 |
Source: | ||
| 3/6/2021 | Contingent | $159,000 |
Source: | ||
| 2/27/2021 | Listed for sale | $159,000+17.8% |
Source: | ||
| 2/16/2021 | Sold | $135,000-20.6% |
Source: Public Record Report a problem | ||
| 1/25/2021 | Price change | $170,000-5.6% |
Source: | ||
| 1/11/2021 | Listed for sale | $180,000+140% |
Source: Midland Realty Group #10968491 Report a problem | ||
| 12/31/2007 | Sold | $75,000-69.8% |
Source: | ||
| 1/19/2006 | Sold | $248,000+83.7% |
Source: Public Record Report a problem | ||
| 7/15/2005 | Sold | $135,000+64.6% |
Source: Public Record Report a problem | ||
| 11/5/1998 | Sold | $82,000 |
Source: Public Record Report a problem | ||
| Year | Property taxes | Tax assessment |
|---|---|---|
| 2024 | -- | $22,001 +144.5% |
| 2023 | $1,899 +2.6% | $8,999 |
| 2022 | $1,851 +2.3% | $8,999 |
| 2021 | $1,810 +6.8% | $8,999 +18.3% |
| 2020 | $1,695 -2.4% | $7,607 -12% |
| 2019 | $1,737 +1.7% | $8,645 |
| 2018 | $1,708 -13.6% | $8,645 -5.9% |
| 2017 | $1,977 -2% | $9,183 -8.8% |
| 2016 | $2,018 +9.3% | $10,074 |
| 2015 | $1,846 +6.1% | $10,074 +7.5% |
| 2014 | $1,739 +2% | $9,375 |
| 2013 | $1,705 -16.5% | $9,375 -17.7% |
| 2012 | $2,043 +10.8% | $11,385 +0% |
| 2011 | $1,844 -0.4% | $11,381 |
| 2010 | $1,852 -6.7% | $11,381 -10.6% |
| 2009 | $1,985 -17.2% | $12,729 -23.8% |
| 2008 | $2,396 +1% | $16,703 |
| 2007 | $2,372 -1.1% | $16,703 |
| 2006 | $2,398 +42.6% | $16,703 +62.3% |
| 2005 | $1,682 +1% | $10,292 |
| 2004 | $1,665 +2.2% | $10,292 |
| 2003 | $1,629 +32.6% | $10,292 +50.6% |
| 2002 | $1,228 +3.7% | $6,835 |
| 2001 | $1,184 +18.9% | $6,835 |
| 2000 | $995 -0.7% | $6,835 +31.9% |
| 1999 | $1,002 | $5,182 |
Find assessor info on the county website
Source: MRED as distributed by MLS GRID. This data may not be complete. We recommend contacting the local school district to confirm school assignments for this home.
A local agent can set up tours, give advice and negotiate with sellers.