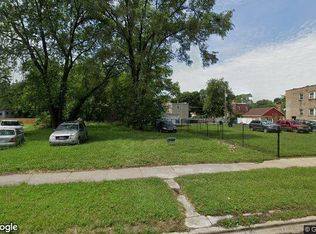
Vacant lot located in the West Englewood community, zoned for residential use. Excellent opportunity for investors and developers to be part of the area's ongoing redevelopment and growth.
Active
$8,500
738 W 54th Pl, Chicago, IL 60609
--beds
--baths
1,742Square Feet
Unimproved Land
Built in ----
1,742 Square Feet Lot
$-- Zestimate®
$--/sqft
$-- HOA
What's special
- --
- on Zillow |
- 65
- views |
- 6
- saves |
Zillow last checked:
Listed by:
David Dominguez 312-847-0444,
Realty of America, LLC,
Aylin Ocampo 773-484-0950,
Realty of America, LLC
Source: MRED as distributed by MLS GRID,MLS#: 12642749
Facts & features
Property
Features
- Frontage length: 25
Lot
- Size: 1,742 Square Feet
- Dimensions: 16.67x125
Details
- Parcel number: 20093240260000
- Zoning: SINGL
- Special conditions: None
Utilities & green energy
- Utilities for property: None
Community & HOA
Location
- Region: Chicago
Financial & listing details
- Tax assessed value: $6,250
- Annual tax amount: $285
- Ownership: Fee Simple
- Road surface type: Asphalt

David Dominguez
(312) 607-0777
By pressing Contact Agent, you agree that the real estate professional identified above may call/text you about your search, which may involve use of automated means and pre-recorded/artificial voices. You don't need to consent as a condition of buying any property, goods, or services. Message/data rates may apply. You also agree to our Terms of Use. Zillow does not endorse any real estate professionals. We may share information about your recent and future site activity with your agent to help them understand what you're looking for in a home.
Estimated market value
Not available
Estimated sales range
Not available
Not available
Price history
| Date | Event | Price |
|---|---|---|
| 7/28/2023 | Listing removed | -- |
Source: | ||
| 5/13/2023 | Listed for sale | $7,000 |
Source: | ||
| 4/22/2023 | Contingent | $7,000 |
Source: | ||
| 3/14/2023 | Price change | $7,000-22.2% |
Source: | ||
| 11/28/2022 | Listed for sale | $9,000+38.5% |
Source: | ||
| 12/26/2020 | Listing removed | -- |
Source: Owner Report a problem | ||
| 7/6/2020 | Listed for sale | $6,500-97.6% |
Source: Owner Report a problem | ||
| 4/29/2011 | Sold | $275,000+957.7% |
Source: Public Record Report a problem | ||
| 7/15/2009 | Sold | $26,000-92.9% |
Source: | ||
| 5/11/2007 | Sold | $365,000+10.6% |
Source: Public Record Report a problem | ||
| 8/30/2006 | Sold | $330,000+65% |
Source: Public Record Report a problem | ||
| 5/19/2006 | Sold | $200,000-11.9% |
Source: Public Record Report a problem | ||
| 6/4/2004 | Sold | $227,000+415.9% |
Source: Public Record Report a problem | ||
| 11/19/2003 | Sold | $44,000-53.7% |
Source: Public Record Report a problem | ||
| 4/7/2000 | Sold | $95,000 |
Source: Public Record Report a problem | ||
Public tax history
| Year | Property taxes | Tax assessment |
|---|---|---|
| 2024 | -- | $625 -53.8% |
| 2023 | $285 +2.6% | $1,353 |
| 2022 | $278 +2.3% | $1,353 |
| 2021 | $272 -9.7% | $1,353 |
| 2020 | $301 +10.9% | $1,353 |
| 2019 | $272 +1.7% | $1,353 |
| 2018 | $267 -91.1% | $1,353 -90.3% |
| 2017 | $3,017 +7.5% | $14,014 |
| 2016 | $2,807 +9.3% | $14,014 |
| 2015 | $2,568 +12% | $14,014 +13.4% |
| 2014 | $2,292 +2% | $12,353 |
| 2013 | $2,247 +1.4% | $12,353 |
| 2012 | $2,217 -3.4% | $12,353 -12.7% |
| 2011 | $2,294 -0.4% | $14,154 |
| 2010 | $2,303 +4.4% | $14,154 |
| 2009 | $2,207 +12% | $14,154 +3.1% |
| 2008 | $1,970 +1% | $13,735 |
| 2007 | $1,951 -1.1% | $13,735 |
| 2006 | $1,972 +76.3% | $13,735 +100.7% |
| 2005 | $1,118 +1% | $6,843 |
| 2004 | $1,107 +2.2% | $6,843 |
| 2003 | $1,083 +79.2% | $6,843 +103.5% |
| 2002 | $604 +3.7% | $3,363 |
| 2001 | $582 +15.3% | $3,363 |
| 2000 | $505 -0.7% | $3,363 +27.9% |
| 1999 | $509 | $2,630 |
Find assessor info on the county website
Monthly payment
Estimated monthly payment$1,822
All calculations are estimates and provided by Zillow, Inc. for informational purposes only. Actual amounts may vary.
HOA fees may include property taxes on listings classified as Co-Ops. Contact the listing agent and/or owner for fee details.
Mortgage interest rates are dependent on a number of factors, including credit score, down payment, and repayment length. Interest rate data provided by Zillow Group Marketplace, Inc. as of 1/1/1970 from various mortgage lenders with which we have lead or other similar arrangements; the Estimated Payment is an average of those rates.
See how much you could borrow to make a competitive offer.
Climate risks
Neighborhood: Back of the Yards
Nearby schools
GreatSchools rating
- 8/10Dewey Elementary Academy Of Fine ArtsGrades: PK-8Distance: 0.1 mi
- 1/10Tilden Career Communty Academy High SchoolGrades: 9-12Distance: 0.8 mi
Schools provided by the listing agent
- District: 299
Source: MRED as distributed by MLS GRID. This data may not be complete. We recommend contacting the local school district to confirm school assignments for this home.


- Illinois
- Cook County
- Chicago
- 60609
- Back of the Yards
- 738 W 54th Pl
Nearby cities
Nearby neighborhoods
Nearby zip codes
Other Chicago Topics
