Solid Brick 2 Unit Building Located in Auburn Gresham, each unit contains 3 Bedrooms with their own closet and 1 Bathroom. Main bedroom can fit a king size bedroom set, bedroom two can fit a queen size bedroom set and bedroom three can fit a full size bedroom set. Hardwood Floors throughout, Living Room and Eat-in Kitchen. Second floor unit vacant for owner occupy or investor to add a new tenant, both units includes enclosed front porch/sunroom living room area with decorated fireplace. New windows throughout the 2nd floor interior within the last 4 months. Potential future opportunity to rent out basement area, was a former two bedroom one bath significant work needed but original plumbing and gas lines still exist. Individually heated tenants pay all utilities. Property is Sold as Is. Perfect for FHA 203K Loan
Foreclosed
Est. $394,600
7649 S May St, Chicago, IL 60620
6beds
2baths
2,472sqft
SingleFamily
Built in 1915
3,720 Square Feet Lot
$394,600 Zestimate®
$160/sqft
$-- HOA
Overview
- 261 days
- 20
- 1
Facts & features
Interior
Bedrooms & bathrooms
- Bedrooms: 6
- Bathrooms: 2
Heating
- Gas
Cooling
- None
Features
- Basement: Finished
- Has fireplace: Yes
Interior area
- Total interior livable area: 2,472 sqft
Property
Features
- Exterior features: Stone
Lot
- Size: 3,720 Square Feet
Details
- Parcel number: 2029409016
Construction
Type & style
- Home type: SingleFamily
Materials
- Roof: Shake / Shingle
Condition
- Year built: 1915
Community & HOA
Location
- Region: Chicago
Financial & listing details
- Price per square foot: $160/sqft
- Tax assessed value: $160,000
- Annual tax amount: $3,215
Foreclosure details
Estimated market value
$394,600
$355,000 - $426,000
$2,545/mo
Price history
| Date | Event | Price |
|---|---|---|
| 1/26/2024 | Sold | $415,000+151.5%$168/sqft |
Source: Public Record Report a problem | ||
| 5/20/2022 | Sold | $165,000-8.1%$67/sqft |
Source:  MRED as distributed by MLS GRID #11299428 Report a problem | ||
| 3/28/2022 | Pending sale | $179,500$73/sqft |
Source: MRED as distributed by MLS GRID #11299428 Report a problem | ||
| 3/1/2022 | Price change | $179,500-5.3%$73/sqft |
Source: MRED as distributed by MLS GRID #11299428 Report a problem | ||
| 1/25/2022 | Listed for sale | $189,500$77/sqft |
Source: MRED as distributed by MLS GRID #11299428 Report a problem | ||
| 1/21/2022 | Pending sale | $189,500$77/sqft |
Source:  Exit Realty #11299428 Report a problem | ||
| 1/20/2022 | Contingent | $189,500$77/sqft |
Source: MRED as distributed by MLS GRID #11299428 Report a problem | ||
| 1/6/2022 | Price change | $189,500-9.3%$77/sqft |
Source: MRED as distributed by MLS GRID #11299428 Report a problem | ||
| 11/15/2021 | Price change | $209,000-4.6%$85/sqft |
Source: MRED as distributed by MLS GRID #11237888 Report a problem | ||
| 10/5/2021 | Listed for sale | $219,000+30.4%$89/sqft |
Source: MRED as distributed by MLS GRID #11237888 Report a problem | ||
| 6/14/2004 | Sold | $168,000-1.2%$68/sqft |
Source: Public Record Report a problem | ||
| 8/14/2002 | Sold | $170,000$69/sqft |
Source: Public Record Report a problem | ||
Public tax history
| Year | Property taxes | Tax assessment |
|---|---|---|
| 2024 | $3,215 +19.5% | $16,000 +25.5% |
| 2023 | $2,690 +2.6% | $12,750 |
| 2022 | $2,622 +2.3% | $12,750 |
| 2021 | $2,564 -2.4% | $12,750 +8.1% |
| 2020 | $2,626 -2.4% | $11,790 -12% |
| 2019 | $2,692 +1.7% | $13,398 |
| 2018 | $2,647 -8.5% | $13,398 -0.3% |
| 2017 | $2,894 +7.5% | $13,442 |
| 2016 | $2,692 +1.6% | $13,442 -7% |
| 2015 | $2,650 +22.2% | $14,461 +23.7% |
| 2014 | $2,168 +2% | $11,687 |
| 2013 | $2,126 -13% | $11,687 -14.2% |
| 2012 | $2,443 -10.1% | $13,616 -18.8% |
| 2011 | $2,717 -0.4% | $16,764 |
| 2010 | $2,728 +4.4% | $16,764 |
| 2009 | $2,614 -15.8% | $16,764 -22.5% |
| 2008 | $3,103 +1% | $21,632 |
| 2007 | $3,072 -1.1% | $21,632 |
| 2006 | $3,105 +31.6% | $21,632 +49.8% |
| 2005 | $2,359 +1% | $14,438 |
| 2004 | $2,335 +2.2% | $14,438 |
| 2003 | $2,285 +10.1% | $14,438 +25% |
| 2002 | $2,075 +3.7% | $11,551 |
| 2001 | $2,000 +9.4% | $11,551 |
| 2000 | $1,829 | $11,551 +21.3% |
| 1999 | -- | $9,522 |
Find assessor info on the county website
Monthly payment
Climate risks
Neighborhood: Gresham

Similar homes
- $414,9005 bd4 ba2.2k sqft7245 S Michigan Ave, Chicago, IL 60619New
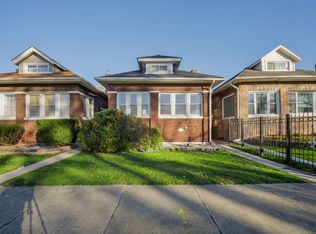 MLS ID #12812036, Eray Unsal, xr realty. MRED as distributed by MLS GRID
- $--7 bd3 ba2.8k sqft3805 S Giles Ave, Chicago, IL 60653Auction
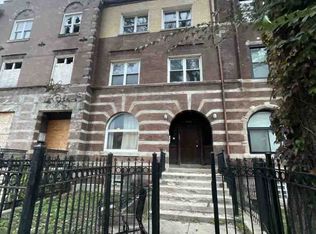 ServiceLink Auction
- $--4 bd1 ba1.7k sqft8719 S Laflin St, Chicago, IL 60620Auction
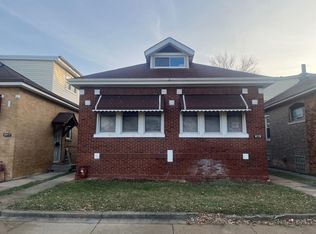 ServiceLink Auction
- $385,0006 bd3 ba1.9k sqft1048 W 92nd Pl, Chicago, IL 60620Active
 MLS ID #12530103, Shelena Lewis, Coldwell Banker Realty. MRED as distributed by MLS GRID
