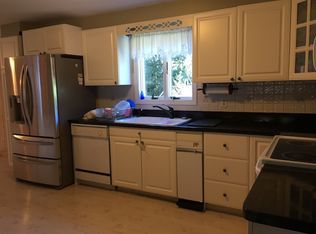
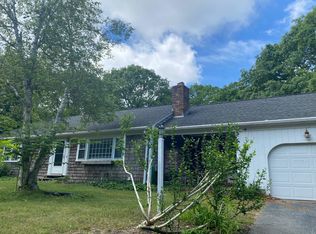
Welcome to this charming ranch-style home in the Mid-Cape area. This 3-bedroom, 1 full bath and 1 half bath home offers comfortable single-level living with a partially finished walk-out basement, fireplace living room, attic storage, attached garage, and a large deck perfect for relaxing or entertaining. Conveniently located with easy access to the highway, Cape Cod Rail Trail, golf courses, and nearby beaches, this home offers the perfect blend of comfort and Cape Cod living.
Pending
Price cut: $15K (8/10)
$580,000
771 W Yarmouth Road, Yarmouth Port, MA 02675
3beds
1,212sqft
Single Family Residence
Built in 1977
0.47 Acres Lot
$569,200 Zestimate®
$479/sqft
$-- HOA
What's special
Attic storageAttached garagePartially finished walk-out basementComfortable single-level living
- 89 days
- 141
- 1
Zillow last checked:
Listing updated:
Listed by:
David Perry 508-648-4158,
Keller Williams Realty
Source: CCIMLS,MLS#: 22603568
Facts & features
Interior
Bedrooms & bathrooms
- Bedrooms: 3
- Bathrooms: 2
- Full bathrooms: 1
- 1/2 bathrooms: 1
Heating
- Natural Gas
Cooling
- None
Appliances
- Included: Natural Gas, Water Heater
Features
- Attic Storage, Linen Closet, Walk-In Closet(s)
- Flooring: Hardwood, Wood, Laminate, Tile
- Number of fireplaces: 1
Interior area
- Total structure area: 1,212
- Total interior livable area: 1,212 sqft
Property
Parking
- Total spaces: 1
- Parking features: Direct Access, Driveway, Paved, Other
- Attached garage spaces: 1
- Has uncovered spaces: Yes
Features
- Stories: 1
- Patio & porch: Deck
Lot
- Size: 0.47 Acres
Details
- Parcel number: YARM M:0105 B:0040 L:0000
- Special conditions: Standard
Construction
Type & style
- Home type: SingleFamily
- Property subtype: Single Family Residence
Materials
- Shingle Siding
- Roof: Asphalt,Pitched
Condition
- Year built: 1977
Utilities & green energy
- Water: Public
Community & HOA
Location
- Region: Yarmouth Port
Financial & listing details
- Price per square foot: $479/sqft
- Tax assessed value: $577,500
- Annual tax amount: $4,025
- Date on market: 7/23/2026
- Cumulative days on market: 49 days
Estimated market value
$569,200
$541,000 - $598,000
$3,090/mo
Price history
| Date | Event | Price |
|---|---|---|
| 9/9/2026 | Pending sale | $580,000$479/sqft |
Source: MLS PIN #73554094 Report a problem | ||
| 8/10/2026 | Price change | $580,000-2.5%$479/sqft |
Source: MLS PIN #73554094 Report a problem | ||
| 7/23/2026 | Listed for sale | $595,000+48.8%$491/sqft |
Source: MLS PIN #73554094 Report a problem | ||
| 8/6/2021 | Sold | $400,000+236.1%$330/sqft |
Source:  CCIMLS #22102832 Report a problem | ||
| 9/8/1999 | Sold | $119,000$98/sqft |
Source: Public Record Report a problem | ||
Public tax history
| Year | Property taxes | Tax assessment |
|---|---|---|
| 2025 | $3,758 +0.4% | $530,800 +4.6% |
| 2024 | $3,744 +2.3% | $507,300 +12.4% |
| 2023 | $3,661 +14.3% | $451,400 +34.8% |
| 2022 | $3,202 | $334,900 |
| 2021 | $3,202 +2.6% | $334,900 +7.3% |
| 2020 | $3,120 +8.6% | $312,000 +9.7% |
| 2019 | $2,872 +6.7% | $284,400 +8.8% |
| 2018 | $2,691 +2.7% | $261,500 |
| 2017 | $2,620 +4.1% | $261,500 +3.6% |
| 2016 | $2,518 +5.1% | $252,300 +5.8% |
| 2015 | $2,395 +2.5% | $238,500 +4.1% |
| 2014 | $2,336 +2.4% | $229,200 -0.8% |
| 2013 | $2,282 +1.8% | $231,000 -3.9% |
| 2012 | $2,242 +6.2% | $240,300 -1.7% |
| 2011 | $2,112 +6.9% | $244,400 -4.5% |
| 2010 | $1,975 +3.3% | $255,800 -9.9% |
| 2009 | $1,911 +2.2% | $284,000 -5.3% |
| 2008 | $1,869 +0.5% | $300,000 -5% |
| 2007 | $1,859 +2.7% | $315,700 +3.4% |
| 2006 | $1,810 +4.9% | $305,200 +20.9% |
| 2005 | $1,726 -38.3% | $252,400 |
| 2004 | $2,797 | $252,400 |
| 2003 | $2,797 +95.9% | $252,400 +90.2% |
| 2001 | $1,428 | $132,700 |
Find assessor info on the county website
Monthly payment
Est. payment
Payment breakdown
Explore the cost of this home by adjusting the details. Changes won't be saved.Climate risks
Neighborhood: Yarmouth Port
Similar homes
- $589,0003 bd2 ba1k sqft233 Union Street, Yarmouth Port, MA 02675For Sale

 MLS ID #22605005, Marchildon, Hagopian & Hayward, Kinlin Grover Compass. CCIMLS
- $559,9003 bd2 ba1k sqft1B Walnut Street, Yarmouth Port, MA 02675For Sale
 MLS ID #22604420, Rob Serroni, Jr, Coldwell Banker Martha Murray. CCIMLS
- $625,0002 bd2 ba1.3k sqft844 W Yarmouth Road, Yarmouth Port, MA 02675For Sale
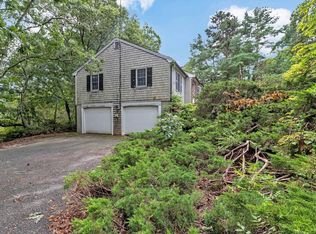 MLS ID #22604887, Ryan Mann, Sotheby's International Realty. CCIMLS
- $649,0003 bd2 ba1.3k sqft2 Mohegan Lane, Yarmouth Port, MA 02675For Sale
 MLS ID #22605035, The Cape House Team, William Raveis Real Estate & Home Services. CCIMLS
- $649,0003 bd2 ba1.4k sqft33 Ellis Circle, Yarmouth Port, MA 02675For SaleMLS ID #22604335, Kelly L Schwarz, EXIT Cape Realty. CCIMLS
- $549,0002 bd2 ba1.2k sqft38 McNamara Avenue, West Yarmouth, MA 02673For SaleMLS ID #22603866, Christa Zevitas, Berkshire Hathaway HomeServices Robert Paul Properties. CCIMLS
- $585,0003 bd1 ba1k sqft67 Diane Avenue, South Yarmouth, MA 02664For SaleMLS ID #22605064, Sandra LaCasse, Jack Conway & Co Inc. CCIMLS
- $679,0003 bd3 ba1.1k sqft38 Captain Small Road, South Yarmouth, MA 02664For SaleMLS ID #22605280, Tori Harrison Farr, Sotheby's International Realty, Inc.. CCIMLS
- $587,0002 bd1 ba1.1k sqft40 Captain Stanley Road, South Yarmouth, MA 02664For SaleMLS ID #22604521, Michelle A Ryan, Today Real Estate. CCIMLS
- $679,0002 bd2 ba1.1k sqft7 Spinning Brook Road, South Yarmouth, MA 02664For SaleMLS ID #22605311, Galya Mihaylova - Assaker, Today Real Estate. CCIMLS
- $799,0003 bd2 ba1.6k sqft106 Pompano Road, Yarmouth Port, MA 02675For SaleMLS ID #22605128, Dara Harris, RE/MAX Executive Realty. CCIMLS
- $550,0002 bd1 ba1.4k sqft67 Lakefield Road, South Yarmouth, MA 02664For SaleMLS ID #22604329, Ryan Mann, Sotheby's International Realty. CCIMLS
- $535,0002 bd1 ba974 sqft142 Winslow Gray Road, West Yarmouth, MA 02673For SaleMLS ID #22605099, Michelle Chaisson-Turmelle, Today Real Estate. CCIMLS
- $499,0003 bd2 ba1k sqft47 Acres Avenue, West Yarmouth, MA 02673For SaleMLS ID #22603718, Michele L Billingsley, LPT Realty. CCIMLS
- $599,0003 bd2 ba1.1k sqft277 Scudder Avenue, Hyannis, MA 02601For SaleMLS ID #22604447, Brian M Greer, Greer Real Estate, LLC. CCIMLS
- $560,0002 bd1 ba976 sqft20 Green Way, South Yarmouth, MA 02664For SaleMLS ID #22604417, Cape Cod Power of Two, Compass. CCIMLS
- $549,4442 bd1 ba936 sqft2 Spectacle Road, East Sandwich, MA 02537For SaleMLS ID #22605329, Erin Cameron, William Raveis Real Estate & Home Services. CCIMLS
- $625,0003 bd2 ba900 sqft46 Pawkannawkut Drive, South Yarmouth, MA 02664For SaleMLS ID #22603054, Sandra Milano, RE/MAX Executive Realty. CCIMLS
- $699,0003 bd2 ba1.4k sqft46 Four Seasons Drive, South Yarmouth, MA 02664For SaleMLS ID #22604044, Johnny K Fallon, LAER Realty Partners. CCIMLS
- $699,9002 bd2 ba1.7k sqft13 Nightingale Drive, South Yarmouth, MA 02664For SaleMLS ID #22605302, Michael P Lotane, Today Real Estate. CCIMLS
