Light filled centrally located 3 bedroom ranch, lovingly cared for by the same family since new and ready for new owners to enjoy. Borders small pond and bog with path for direct access in rear yard to nature trails. Recently updated bathrooms, HVAC and on demand generator. 2.3 miles from Grays Beach and easy access to Yarmouth Port Village and Route 6.
Pending
$589,000
233 Union Street, Yarmouth Port, MA 02675
3beds
1,092sqft
Single Family Residence
Built in 1982
0.53 Acres Lot
$584,400 Zestimate®
$539/sqft
$-- HOA
What's special
Light filledRecently updated bathrooms
- 48 days
- 130
- 8
Likely to sell faster than
Zillow last checked:
Listing updated:
Listed by:
Marchildon, Hagopian & Hayward 508-221-0676,
Kinlin Grover Compass,
Jesse R Hagopian 774-994-3741,
Kinlin Grover Compass
Source: CCIMLS,MLS#: 22605005
Facts & features
Interior
Bedrooms & bathrooms
- Bedrooms: 3
- Bathrooms: 2
- Full bathrooms: 1
- 1/2 bathrooms: 1
Heating
- Natural Gas
Cooling
- Central Air
Appliances
- Included: Gas Range, Refrigerator, Electric, Natural Gas, Water Heater
Features
- Attic Storage
- Flooring: Laminate, Carpet
Interior area
- Total structure area: 1,092
- Total interior livable area: 1,092 sqft
Property
Parking
- Total spaces: 5
- Parking features: Garage Door Opener, Driveway, Off Street, Paved
- Attached garage spaces: 1
- Has uncovered spaces: Yes
Features
- Stories: 1
- Patio & porch: Deck
- Exterior features: Underground Sprinkler System
Lot
- Size: 0.53 Acres
Details
- Parcel number: YARM M:0106 B:0083 L:0000
- Special conditions: Standard
Construction
Type & style
- Home type: SingleFamily
- Property subtype: Single Family Residence
Materials
- Shingle Siding
- Roof: Asphalt
Condition
- Year built: 1982
Utilities & green energy
- Water: Public
Community & HOA
Location
- Region: Yarmouth Port
Financial & listing details
- Price per square foot: $539/sqft
- Tax assessed value: $529,300
- Annual tax amount: $3,689
- Date on market: 10/2/2026
- Cumulative days on market: 48 days
Estimated market value
$584,400
$555,000 - $614,000
$3,085/mo
Price history
| Date | Event | Price |
|---|---|---|
| 10/21/2026 | Pending sale | $589,000$539/sqft |
Source:  CCIMLS #22605005 Report a problem | ||
| 10/2/2026 | Listed for sale | $589,000$539/sqft |
Source: CCIMLS #22605005 Report a problem | ||
Public tax history
| Year | Property taxes | Tax assessment |
|---|---|---|
| 2025 | $3,399 -0.1% | $480,100 +4.1% |
| 2024 | $3,403 +2.3% | $461,100 +12.4% |
| 2023 | $3,328 +13% | $410,300 +33.3% |
| 2022 | $2,944 | $307,900 |
| 2021 | $2,944 +2.2% | $307,900 +6.9% |
| 2020 | $2,881 +7.9% | $288,100 +9% |
| 2019 | $2,670 +7.6% | $264,400 +9.6% |
| 2018 | $2,482 +2.7% | $241,200 |
| 2017 | $2,417 +4.5% | $241,200 +4% |
| 2016 | $2,314 +5.5% | $231,900 +6.2% |
| 2015 | $2,193 +3.1% | $218,400 +4.6% |
| 2014 | $2,128 +2.1% | $208,800 -1% |
| 2013 | $2,084 +1.8% | $210,900 -3.9% |
| 2012 | $2,048 +5.1% | $219,500 -2.7% |
| 2011 | $1,948 +3.2% | $225,500 -7.8% |
| 2010 | $1,888 +3.3% | $244,600 -9.9% |
| 2009 | $1,827 +2% | $271,400 -5.6% |
| 2008 | $1,791 +0.2% | $287,400 -5.3% |
| 2007 | $1,788 +0.8% | $303,500 +1.5% |
| 2006 | $1,774 +5.5% | $299,100 +21.7% |
| 2005 | $1,681 -38.3% | $245,800 |
| 2004 | $2,723 | $245,800 |
| 2003 | $2,723 +97.6% | $245,800 +91.9% |
| 2001 | $1,378 | $128,100 |
Find assessor info on the county website
Monthly payment
Est. payment
Payment breakdown
Explore the cost of this home by adjusting the details. Changes won't be saved.Climate risks
Neighborhood: Yarmouth Port
Similar homes
- $625,0002 bd2 ba1.3k sqft844 W Yarmouth Road, Yarmouth Port, MA 02675For Sale
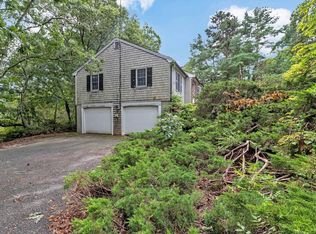
 MLS ID #22604887, Ryan Mann, Sotheby's International Realty. CCIMLS
- $699,0003 bd2 ba1.2k sqft7 Bent Bluff Ln, Yarmouth Port, MA 02675For Sale
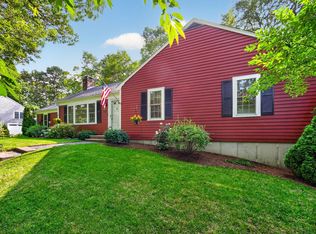 MLS ID #73563868, Pam Canham Roberts, Gibson Sotheby's International Realty. MLS PIN
- $500,0003 bd1 ba952 sqft99 Jefferson Avenue, West Yarmouth, MA 02673For Sale
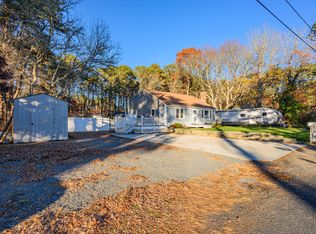 MLS ID #22605753, Amy L Harbeck, Kinlin Grover Compass. CCIMLS
- $599,0003 bd1 ba1k sqft2 David Drive, South Dennis, MA 02660For Sale
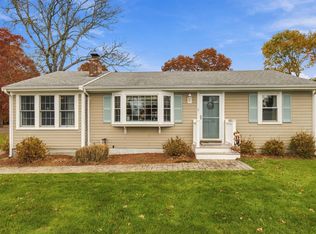 MLS ID #22605626, Susan E Sullivan, Realty Consultants of Cape Cod. CCIMLS
- $549,0002 bd2 ba1.2k sqft38 McNamara Avenue, West Yarmouth, MA 02673For SaleMLS ID #22603866, Christa Zevitas, Berkshire Hathaway HomeServices Robert Paul Properties. CCIMLS
- $649,0003 bd2 ba1.4k sqft46 Four Seasons Drive, South Yarmouth, MA 02664For SaleMLS ID #22604044, Johnny K Fallon, LAER Realty Partners. CCIMLS
- $625,0002 bd3 ba1.5k sqft3 John Hall Cartway UNIT 3, Yarmouth Port, MA 02675For SaleMLS ID #22605623, Laurie B Miller, Sotheby's International Realty, Inc.. CCIMLS
- $535,0002 bd1 ba974 sqft142 Winslow Gray Road, West Yarmouth, MA 02673For SaleMLS ID #22605099, Michelle Chaisson-Turmelle, Today Real Estate. CCIMLS
- $589,0002 bd1 ba996 sqft41 Graces Way, South Dennis, MA 02660For SaleMLS ID #22605644, Ryan Mann, Sotheby's International Realty. CCIMLS
- $499,9002 bd2 ba1.1k sqft59 Debs Hill Road #42A, Yarmouth Port, MA 02675For SaleMLS ID #22603968, Gerry Coughlan, Kinlin Grover Compass. CCIMLS
- $515,0002 bd1 ba888 sqft50 Shallow Brook Road, South Yarmouth, MA 02664For SaleMLS ID #22605359, Ned B Chatelain, Chatelain Real Estate. CCIMLS
- $679,0002 bd2 ba1.1k sqft7 Spinning Brook Road, South Yarmouth, MA 02664For SaleMLS ID #22605311, Galya Mihaylova - Assaker, Today Real Estate. CCIMLS
- $599,0003 bd1 ba1k sqft239 Swan River Road, West Dennis, MA 02670For SaleMLS ID #22604553, Rory Eames, Coldwell Banker Martha Murray. CCIMLS
- $599,0002 bd2 ba1.3k sqft67 Triangle Circle, Sandwich, MA 02563For SaleMLS ID #22605653, Kayla L Hilts, Today Real Estate. CCIMLS
- $525,0003 bd2 ba1.2k sqft174 S Yarmouth Road, Dennis, MA 02638For SaleMLS ID #22605350, The Cape House Team, William Raveis Real Estate & Home Services. CCIMLS
- $597,0002 bd1 ba1k sqft235 Arrowhead Drive, Hyannis, MA 02601For SaleMLS ID #22605445, Teresa Fletcher, EXIT Cape Realty. CCIMLS
- $699,9993 bd2 ba1.3k sqft119 Governors Way, Barnstable, MA 02630For SaleMLS ID #22605491, Patrick J Foran, Foran Realty. CCIMLS
- $539,0003 bd1 ba1k sqft222 Mayfair Road, South Dennis, MA 02660For SaleMLS ID #22604527, Karen St. Amand, Today Real Estate. CCIMLS
- $635,0003 bd2 ba1.2k sqft44 Millrace Road, Marstons Mills, MA 02648For SaleMLS ID #22605599, Becky A Kanaley, Compass. CCIMLS
