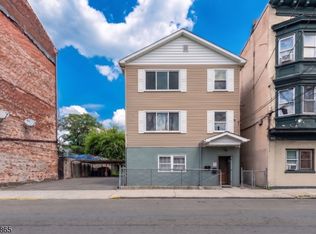
$722,600
-- bd|-- ba|-- sqft
773 E 22nd St, Paterson, NJ 07513
Off Market
Zillow last checked:
Listing updated:
Maria Granata 973-652-3301,
United Real Estate
$803,700
$764,000 - $844,000
$2,056/mo
| Date | Event | Price |
|---|---|---|
| 6/23/2026 | Pending sale | $789,900$226/sqft |
Source: | ||
| 5/16/2026 | Listed for sale | $789,900+187.2%$226/sqft |
Source: | ||
| 7/24/2019 | Sold | $275,000-8.3%$79/sqft |
Source: Public Record Report a problem | ||
| 3/14/2019 | Listing removed | $300,000$86/sqft |
Source: Keller Williams City Views Realty #1840533 Report a problem | ||
| 12/28/2018 | Price change | $300,000+43.5%$86/sqft |
Source: Keller Williams City Views Realty #1840533 Report a problem | ||
| 9/29/2018 | Price change | $209,000+67.2%$60/sqft |
Source: Keller Williams City Views Realty #1840533 Report a problem | ||
| 9/4/2018 | Listed for sale | -- |
Source: Auction.com Report a problem | ||
| 3/14/2018 | Sold | $125,000-56.1%$36/sqft |
Source: Public Record Report a problem | ||
| 1/20/2010 | Sold | $285,000+204.8%$81/sqft |
Source: Public Record Report a problem | ||
| 3/11/2009 | Sold | $93,500-22%$27/sqft |
Source: Public Record Report a problem | ||
| 12/7/2008 | Price change | $119,900-29.4%$34/sqft |
Source: Century 21 #2468722 Report a problem | ||
| 10/4/2008 | Price change | $169,900-22.7%$49/sqft |
Source: Century 21 #2468722 Report a problem | ||
| 8/15/2008 | Price change | $219,900-20%$63/sqft |
Source: Century 21 #2468722 Report a problem | ||
| 4/5/2008 | Price change | $274,900-6.8%$79/sqft |
Source: Century 21 #2468722 Report a problem | ||
| 3/15/2008 | Listed for sale | $295,000-13.1%$84/sqft |
Source: Century 21 #2468722 Report a problem | ||
| 11/21/2007 | Sold | $339,591+30.6%$97/sqft |
Source: Public Record Report a problem | ||
| 8/19/2003 | Sold | $260,000+52.9%$74/sqft |
Source: Public Record Report a problem | ||
| 10/14/1998 | Sold | $170,000$49/sqft |
Source: Public Record Report a problem | ||
| Year | Property taxes | Tax assessment |
|---|---|---|
| 2025 | $14,144 +3.9% | $277,600 |
| 2024 | $13,611 +1.8% | $277,600 |
| 2023 | $13,372 +7.6% | $277,600 |
| 2022 | $12,425 | $277,600 |
| 2021 | $12,425 +10.8% | $277,600 |
| 2020 | $11,216 +19% | $277,600 +2.3% |
| 2019 | $9,422 +4.8% | $271,300 +24.6% |
| 2018 | $8,990 -17.1% | $217,800 +0.8% |
| 2017 | $10,839 +5.6% | $216,100 -13.5% |
| 2016 | $10,262 +0.5% | $249,800 |
| 2015 | $10,208 +5.7% | $249,800 -29% |
| 2014 | $9,659 +9.1% | $352,000 |
| 2013 | $8,853 | $352,000 |
| 2012 | $8,853 +18.3% | $352,000 |
| 2011 | $7,484 -21% | $352,000 |
| 2010 | $9,470 | $352,000 -28.2% |
| 2009 | -- | $490,400 |
| 2008 | -- | $490,400 |
| 2007 | -- | $490,400 +1978% |
| 2006 | -- | $23,600 |
| 2005 | -- | $23,600 |
| 2004 | -- | $23,600 |
| 2003 | -- | $23,600 |
| 2002 | -- | $23,600 |
| 2001 | -- | $23,600 |
Find assessor info on the county website
A local agent can set up tours, give advice and negotiate with sellers.
A local lender can help you make sure your offer is ready when you are.