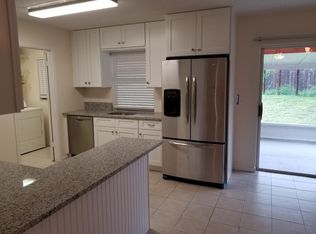
This 2256 square foot multi family home has 2 bedrooms and 4.0 bathrooms. This home is located at 7943 SE Highpoint Way, Hobe Sound, FL 33455.
Pre-foreclosure
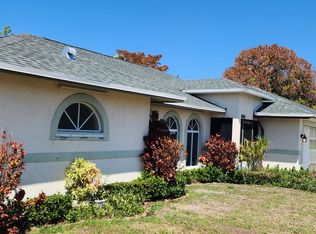
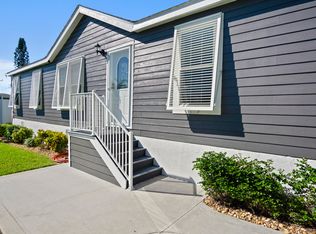
Street View
Est. $402,800
7943 SE Highpoint Way, Hobe Sound, FL 33455
2beds
4baths
2,256sqft
MultiFamily
Built in 1984
-- sqft lot
$402,800 Zestimate®
$179/sqft
$400/mo HOA
Overview
- 284 days |
- 14 |
- 0 |
Facts & features
Interior
Bedrooms & bathrooms
- Bedrooms: 2
- Bathrooms: 4
Heating
- Other
Cooling
- Central
Features
- Has fireplace: No
Interior area
- Total interior livable area: 2,256 sqft
Property
Parking
- Total spaces: 1
- Parking features: Garage - Attached
Features
- Exterior features: Stucco
Lot
- Size: 0.54 Acres
Details
- Parcel number: 343842510000001502
Construction
Type & style
- Home type: MultiFamily
Materials
- Concrete Block
- Roof: Composition
Condition
- Year built: 1984
Community & HOA
HOA
- Has HOA: Yes
- HOA fee: $400 monthly
Location
- Region: Hobe Sound
Financial & listing details
- Price per square foot: $179/sqft
- Tax assessed value: $332,640
- Annual tax amount: $2,968
Visit our professional directory to find a foreclosure specialist in your area that can help with your home search.
Find a foreclosure agentForeclosure details
Estimated market value
$402,800
$354,000 - $455,000
$2,311/mo
Price history
| Date | Event | Price |
|---|---|---|
| 4/1/1989 | Sold | $105,000$47/sqft |
Source: Agent Provided Report a problem | ||
Public tax history
| Year | Property taxes | Tax assessment |
|---|---|---|
| 2025 | $2,968 +0.6% | $171,710 +2.9% |
| 2024 | $2,950 +3.2% | $166,871 +3% |
| 2023 | $2,858 +4.1% | $162,011 +3% |
| 2022 | $2,744 -24.5% | $157,293 +6.7% |
| 2021 | $3,636 +9.1% | $147,408 +10% |
| 2020 | $3,331 +10% | $134,008 +10% |
| 2019 | $3,027 | $121,826 -19.5% |
| 2018 | $3,027 +6.5% | $151,380 +11.5% |
| 2017 | $2,843 +32.5% | $135,820 +48.4% |
| 2016 | $2,145 | $91,530 -18.2% |
| 2015 | $2,145 | $111,860 +17% |
| 2014 | $2,145 | $95,640 -1.4% |
| 2013 | -- | $96,960 -0.2% |
| 2012 | -- | $97,200 -3.8% |
| 2011 | -- | $101,090 +23.9% |
| 2010 | -- | $81,605 +22.9% |
| 2008 | -- | $66,416 -49.2% |
| 2007 | $2,482 | $130,761 +1.7% |
| 2005 | -- | $128,625 +9.6% |
| 2004 | $1,698 | $117,331 |
| 2003 | $1,698 +18.4% | $117,331 +14.4% |
| 2002 | $1,435 +2.4% | $102,530 +2.3% |
| 2001 | $1,401 +3.8% | $100,264 +3.3% |
| 2000 | $1,350 +6.7% | $97,033 +4.7% |
| 1999 | $1,265 | $92,655 |
Find assessor info on the county website
Monthly payment
Estimated monthly payment$1,822
All calculations are estimates and provided by Zillow, Inc. for informational purposes only. Actual amounts may vary.
HOA fees may include property taxes on listings classified as Co-Ops. Contact the listing agent and/or owner for fee details.
Mortgage interest rates are dependent on a number of factors, including credit score, down payment, and repayment length. Interest rate data provided by Zillow Group Marketplace, Inc. as of 1/1/1970 from various mortgage lenders with which we have lead or other similar arrangements; the Estimated Payment is an average of those rates.
See how much you could borrow to make a competitive offer.
Climate risks
Neighborhood: 33455
Nearby schools
GreatSchools rating
- 3/10Hobe Sound Elementary SchoolGrades: PK-5Distance: 2 mi
- 4/10Murray Middle SchoolGrades: 6-8Distance: 4.4 mi
- 5/10South Fork High SchoolGrades: 9-12Distance: 6.5 mi


- Florida
- Martin County
- Hobe Sound
- 33455
- 7943 SE Highpoint Way
Nearby cities
Nearby zip codes
Other Hobe Sound Topics
