$143,700
2 bd|3 ba|3.4k sqft
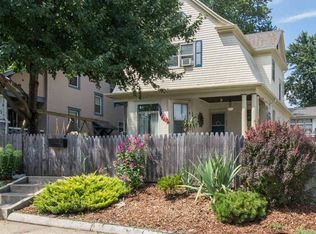
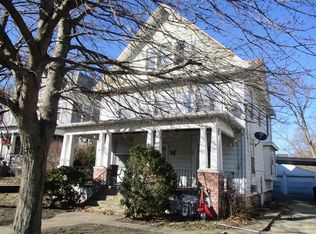
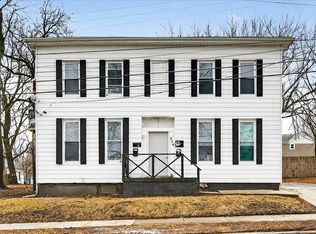
809 W Washington St, Bloomington, IL 61701
Off Market
Zillow last checked:
Listing updated:
Nate Evans (217)239-7113,
eXp Realty-Mahomet,
Molly Jones 217-493-6200,
eXp Realty-Mahomet
Not available
Estimated sales range
Not available
Not available
| Date | Event | Price |
|---|---|---|
| 4/29/2026 | Pending sale | $205,000 |
Source: | ||
| 4/28/2026 | Listing removed | $205,000 |
Source: eXp Realty #12622327 Report a problem | ||
| 4/17/2026 | Pending sale | $205,000-36.9% |
Source: | ||
| 6/2/2022 | Sold | $325,000+159% |
Source: Public Record Report a problem | ||
| 1/25/2021 | Listing removed | -- |
Source: Zillow Rental Manager Report a problem | ||
| 12/21/2020 | Listed for rent | $575 |
Source: Owner Report a problem | ||
| 3/29/2020 | Listing removed | $575 |
Source: Owner Report a problem | ||
| 1/2/2020 | Price change | $575-11.5% |
Source: Owner Report a problem | ||
| 11/5/2019 | Listed for rent | $650+13% |
Source: Owner Report a problem | ||
| 7/20/2019 | Listing removed | $575 |
Source: Owner Report a problem | ||
| 6/19/2019 | Listed for rent | $575-11.5% |
Source: Owner Report a problem | ||
| 5/18/2019 | Listing removed | $650 |
Source: Owner Report a problem | ||
| 1/13/2019 | Listed for rent | $650+8.3% |
Source: Owner Report a problem | ||
| 12/11/2018 | Listing removed | $600 |
Source: Owner Report a problem | ||
| 6/28/2018 | Listed for rent | $600 |
Source: Owner Report a problem | ||
| 5/12/2018 | Listing removed | $600 |
Source: Owner Report a problem | ||
| 12/16/2017 | Listed for rent | $600 |
Source: Owner Report a problem | ||
| 11/15/2017 | Sold | $125,500+10.6% |
Source: Public Record Report a problem | ||
| 5/27/2008 | Sold | $113,500 |
Source: Public Record Report a problem | ||
| Year | Property taxes | Tax assessment |
|---|---|---|
| 2024 | $3,145 +0.2% | $38,789 +3.3% |
| 2023 | $3,137 +10% | $37,535 +11.9% |
| 2022 | $2,852 +9.2% | $33,557 +9.2% |
| 2021 | $2,611 | $30,719 +4% |
| 2020 | -- | $29,537 |
| 2019 | -- | $29,537 |
| 2018 | $2,486 | $29,537 |
| 2017 | $2,486 0% | $29,537 |
| 2016 | $2,487 +3.3% | $29,537 +2.8% |
| 2015 | $2,408 | $28,728 |
| 2014 | $2,408 +5% | $28,728 |
| 2013 | $2,294 -2.3% | $28,728 -1.1% |
| 2012 | $2,348 | $29,045 -3.2% |
| 2011 | $2,348 +0.4% | $30,017 |
| 2010 | $2,339 +0.7% | $30,017 |
| 2009 | $2,324 +2% | $30,017 +0.8% |
| 2008 | $2,277 +2.9% | $29,784 +2.6% |
| 2007 | $2,213 | $29,043 +6.6% |
| 2006 | -- | $27,249 +2.1% |
| 2005 | -- | $26,688 |
Find assessor info on the county website
Source: MRED as distributed by MLS GRID. This data may not be complete. We recommend contacting the local school district to confirm school assignments for this home.
A local agent can set up tours, give advice and negotiate with sellers.
A local lender can help you make sure your offer is ready when you are.