Two separate houses in one lot. 2 different addresses 814 and 816 N. Jackson Street. 2 Gas meters, 2 electric meters. Front house 2 bedroom one bath with a front carport for 3 cars. Back house 3 bedrooms 1 bath. 2 car garage attached. Both houses need TLC they were rented to same tenants for almost 15 years.
For sale
Listed by: Fenix Properties • Manuel Ruiz • Contact: fenixproperties@sbcglobal.net
$990,000
816 N Jackson St, Santa Ana, CA 92703
5beds
2baths
2,061sqft
Multi Family
Built in 1965
-- sqft lot
$997,600 Zestimate®
$480/sqft
$-- HOA
What's special
- 2 days
- 77
- 1
Zillow last checked:
Listing updated:
Listed by:
Manuel Ruiz DRE #01110989 fenixproperties@sbcglobal.net,
Fenix Properties
Source: CRMLS,MLS#: OC26226872 Originating MLS: California Regional MLS
Facts & features
Interior
Bedrooms & bathrooms
- Bedrooms: 5
- Bathrooms: 2
Heating
- None
Cooling
- None
Appliances
- Laundry: Electric Dryer Hookup, Gas Dryer Hookup, Inside
Features
- Has fireplace: No
- Fireplace features: None
- Common walls with other units/homes: No Common Walls
Interior area
- Total structure area: 2,061
- Total interior livable area: 2,061 sqft
Property
Parking
- Total spaces: 2
- Parking features: Direct Access, Driveway, Garage Faces Front, Garage
- Garage spaces: 2
Features
- Entry location: Front
- Pool features: None
Lot
- Size: 6,098 Square Feet
- Features: 2-5 Units/Acre, Walkstreet
Details
- Parcel number: 19817102
- Special conditions: Standard
Construction
Type & style
- Home type: MultiFamily
- Property subtype: Multi Family
Condition
- New construction: No
- Year built: 1965
Utilities & green energy
- Sewer: Public Sewer
- Water: Public
- Utilities for property: Electricity Connected, Natural Gas Available
Community & HOA
Community
- Features: Golf, Urban
Location
- Region: Santa Ana
Financial & listing details
- Price per square foot: $480/sqft
- Tax assessed value: $804,978
- Date on market: 10/19/2026
- Listing terms: Cash,Cash to New Loan,Conventional,1031 Exchange
Estimated market value
$997,600
$948,000 - $1.05M
$3,023/mo
Price history
| Date | Event | Price |
|---|---|---|
| 10/20/2026 | Listed for sale | $990,000+147.5%$480/sqft |
Source:  CRMLS #OC26226872 Report a problem | ||
| 3/21/2017 | Sold | $400,000-39.1%$194/sqft |
Source: Public Record Report a problem | ||
| 11/28/2006 | Sold | $657,000+28.8%$319/sqft |
Source: Public Record Report a problem | ||
| 7/27/2004 | Sold | $510,000+218.8%$247/sqft |
Source: Public Record Report a problem | ||
| 1/15/1999 | Sold | $160,000+27%$78/sqft |
Source: Public Record Report a problem | ||
| 8/17/1998 | Sold | $125,950$61/sqft |
Source: Public Record Report a problem | ||
Public tax history
| Year | Property taxes | Tax assessment |
|---|---|---|
| 2026 | -- | $804,978 +2% |
| 2025 | $9,388 +2.6% | $789,195 +2% |
| 2024 | $9,152 +1.8% | $773,721 +2% |
| 2023 | $8,987 +2.3% | $758,550 +2% |
| 2022 | $8,786 +1.4% | $743,677 +2% |
| 2021 | $8,667 | $729,096 +1% |
| 2020 | -- | $721,621 +2% |
| 2019 | $8,562 +1.4% | $707,472 +2% |
| 2018 | $8,448 +48.3% | $693,600 +50.1% |
| 2017 | $5,696 | $462,060 +2% |
| 2016 | $5,696 +4.6% | $453,000 |
| 2015 | $5,447 +0.5% | $453,000 |
| 2014 | $5,421 | $453,000 +13.1% |
| 2013 | -- | $400,608 +7% |
| 2012 | -- | $374,400 -4% |
| 2011 | -- | $390,000 -13.3% |
| 2010 | -- | $450,000 |
| 2009 | -- | $450,000 -32.8% |
| 2008 | -- | $670,140 +2% |
| 2007 | -- | $657,000 +26.3% |
| 2006 | -- | $520,200 +2% |
| 2005 | -- | $510,000 +189.3% |
| 2004 | -- | $176,310 +1.9% |
| 2003 | -- | $173,079 +2% |
| 2002 | -- | $169,686 +2% |
| 2001 | $1,798 +1.9% | $166,359 +2% |
| 2000 | $1,764 | $163,098 |
Find assessor info on the county website
Monthly payment
Est. payment
Payment breakdown
Explore the cost of this home by adjusting the details. Changes won't be saved.Climate risks
Neighborhood: Santa Anita
Similar homes
- $979,9994 bd3 ba2.1k sqft4272 W 5th St, Santa Ana, CA 92703For Sale
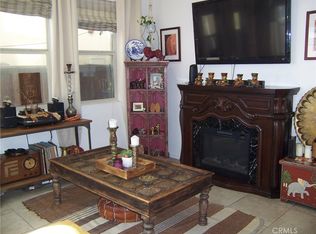 MLS ID #DW26225347, Minerva Miranda, VIP RE Firm. CRMLS
- $1,149,0004 bd2 ba1.9k sqft805 N Euclid St, Santa Ana, CA 92703For Sale
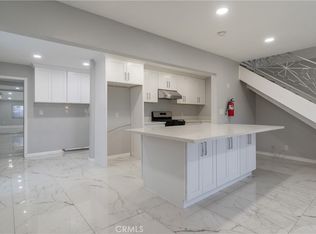 MLS ID #PW26226664, Thomas Luong, Superior Real Estate Group. CRMLS
- $938,0003 bd2 ba1.2k sqft702 S Arapaho Dr, Santa Ana, CA 92704For Sale
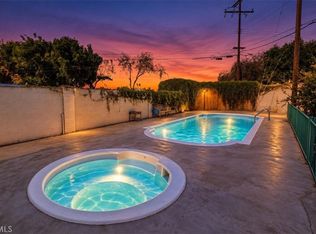 MLS ID #OC26217887, Megan Bixler, Alta Realty Group CA, Inc. CRMLS
- $999,0005 bd3 ba2.7k sqft15602 Newhope St, Santa Ana, CA 92704For Sale
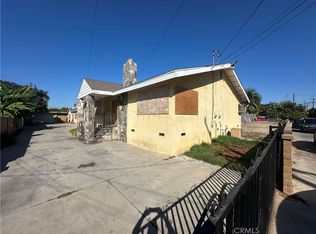 MLS ID #IV26218402, NATALIE HORNE, EXP REALTY OF CALIFORNIA INC. CRMLS
