This home sits on a corner lot and has a covered carport. Lots of potential to make this home shine and priced to sell.
Active
$94,900
823 N Jackson St, San Angelo, TX 76901
2beds
783sqft
Single Family Residence
Built in 1959
6,098 Square Feet Lot
$91,100 Zestimate®
$121/sqft
$-- HOA
What's special
Corner lotCovered carport
- 25 days
- 125
- 7
Likely to sell faster than
Zillow last checked:
Listing updated:
Listed by:
Chris Chill Hill Team 325-245-8350,
REMAX Home and Ranch
Source: San Angelo AOR,MLS#: 202514
Facts & features
Interior
Bedrooms & bathrooms
- Bedrooms: 2
- Bathrooms: 1
- Full bathrooms: 1
Primary bedroom
- Area: 132 Square Feet
- Dimensions: 12.0000 x 11.0000
Bedroom 2
- Area: 121 Square Feet
- Dimensions: 11.0000 x 11.0000
Kitchen
- Area: 100 Square Feet
- Dimensions: 10.0000 x 10.0000
Living room
- Area: 120 Square Feet
- Dimensions: 12.0000 x 10.0000
Heating
- Other
Cooling
- Other
Appliances
- Laundry: Other
Features
- Flooring: Other
- Has basement: No
- Has fireplace: No
Interior area
- Total structure area: 783
- Total interior livable area: 783 sqft
Property
Features
- Levels: One
Lot
- Size: 6,098 Square Feet
- Features: Interior Lot
Details
- Parcel number: R000014525
Construction
Type & style
- Home type: SingleFamily
- Property subtype: Single Family Residence
Materials
- Vinyl Siding
- Foundation: Pillar/Post/Pier
- Roof: Composition
Condition
- Year built: 1959
Utilities & green energy
- Water: Public
Community & HOA
Community
- Subdivision: Loves
HOA
- Has HOA: No
Location
- Region: San Angelo
Financial & listing details
- Price per square foot: $121/sqft
- Tax assessed value: $78,030
- Annual tax amount: $1,823
- Date on market: 9/23/2026
- Listing terms: Cash,Conventional
- Road surface type: Paved
Estimated market value
$91,100
$87,000 - $96,000
$962/mo
Price history
| Date | Event | Price |
|---|---|---|
| 9/23/2026 | Listed for sale | $94,900$121/sqft |
Source:  San Angelo AOR #202514 Report a problem | ||
| 12/11/2025 | Listed for rent | $1,095$1/sqft |
Source: Zillow Rentals Report a problem | ||
| 12/11/2025 | Listing removed | $1,095$1/sqft |
Source: Zillow Rentals Report a problem | ||
| 11/14/2025 | Listed for rent | $1,095$1/sqft |
Source: Zillow Rentals Report a problem | ||
| 11/14/2025 | Listing removed | $1,095$1/sqft |
Source: Zillow Rentals Report a problem | ||
| 10/24/2025 | Listed for rent | $1,095$1/sqft |
Source: Zillow Rentals Report a problem | ||
| 10/24/2025 | Listing removed | $1,095$1/sqft |
Source: Zillow Rentals Report a problem | ||
| 10/16/2025 | Listed for rent | $1,095$1/sqft |
Source: Zillow Rentals Report a problem | ||
| 5/23/2025 | Listing removed | $1,095$1/sqft |
Source: Zillow Rentals Report a problem | ||
| 4/26/2025 | Listed for rent | $1,095+4.3%$1/sqft |
Source: Zillow Rentals Report a problem | ||
| 4/26/2025 | Listing removed | $1,050$1/sqft |
Source: Zillow Rentals Report a problem | ||
| 4/15/2025 | Price change | $1,050-4.1%$1/sqft |
Source: Zillow Rentals Report a problem | ||
| 4/7/2025 | Price change | $1,095+4.3%$1/sqft |
Source: Zillow Rentals Report a problem | ||
| 4/6/2025 | Listed for rent | $1,050$1/sqft |
Source: Zillow Rentals Report a problem | ||
| 4/6/2025 | Listing removed | $1,050$1/sqft |
Source: Zillow Rentals Report a problem | ||
| 3/12/2025 | Listed for rent | $1,050$1/sqft |
Source: Zillow Rentals Report a problem | ||
| 9/7/2016 | Sold | -- |
Source: San Angelo AOR #88170 Report a problem | ||
Public tax history
| Year | Property taxes | Tax assessment |
|---|---|---|
| 2025 | $1,823 +15.7% | $78,030 +1% |
| 2024 | $1,576 -9.6% | $77,270 -11.8% |
| 2023 | $1,743 +49.8% | $87,620 +66.9% |
| 2022 | $1,163 -21.5% | $52,500 -14.1% |
| 2021 | $1,481 | $61,100 +11.5% |
| 2020 | -- | $54,820 +40.2% |
| 2019 | $961 -2.5% | $39,110 |
| 2018 | $986 +0.5% | $39,110 |
| 2017 | $981 -0.6% | $39,110 |
| 2016 | $987 | $39,110 |
| 2015 | $987 -1.5% | $39,110 |
| 2014 | $1,002 +1.6% | $39,110 +1.6% |
| 2013 | $986 -0.2% | $38,500 |
| 2012 | $988 +4.8% | $38,500 +8.5% |
| 2011 | $943 -1.5% | $35,500 |
| 2010 | $957 | $35,500 |
| 2009 | -- | $35,500 +82.1% |
| 2008 | -- | $19,500 |
| 2007 | $483 -16.1% | $19,500 |
| 2006 | $575 | $19,500 |
| 2005 | $575 -0.6% | $19,500 |
| 2004 | $578 +0.3% | $19,500 |
| 2003 | $577 -0.1% | $19,500 |
| 2002 | $577 +2.5% | $19,500 |
| 2001 | $563 +1.3% | $19,500 |
| 2000 | $556 | $19,500 |
Find assessor info on the county website
Monthly payment
Est. payment
Payment breakdown
Explore the cost of this home by adjusting the details. Changes won't be saved.Climate risks
Neighborhood: Central
Nearby schools
Schools provided by the listing agent
- Elementary: McGill
- Middle: Lone Star
- High: Central
Source: San Angelo AOR. This data may not be complete. We recommend contacting the local school district to confirm school assignments for this home.
- $150,100-- bd-- ba1.3k sqft821 N Jackson St, San Angelo, TX 76901Off Market
- $163,700-- bd-- ba1.4k sqft819 N Jackson St, San Angelo, TX 76901Off Market
- $167,200-- bd-- ba1.3k sqft901 N Jackson St, San Angelo, TX 76901Off Market
- $142,400-- bd-- ba1k sqft814 N Van Buren St, San Angelo, TX 76901Off Market
Similar homes
- $95,0002 bd1 ba924 sqft1103 N Garfield St, San Angelo, TX 76901For Sale
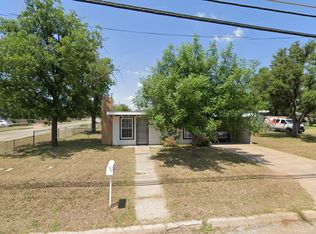 MLS ID #202664, John Biera, Coldwell Banker Legacy. San Angelo AOR
- $94,0003 bd1 ba840 sqft2214 Juanita Ave, San Angelo, TX 76901For Sale
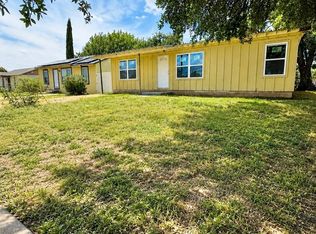 MLS ID #201858, Apolynne McCarthy, ERA Newlin & Company. San Angelo AOR
- $127,0002 bd1 ba816 sqft1951 Guadalupe St, San Angelo, TX 76901For Sale
 MLS ID #202710, Landry Scott, ERA Newlin & Company. San Angelo AOR
- $--3 bd1 ba1.1k sqft1152 E 23rd St, San Angelo, TX 76903Auction
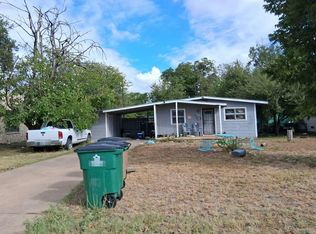 Auction.com 2
