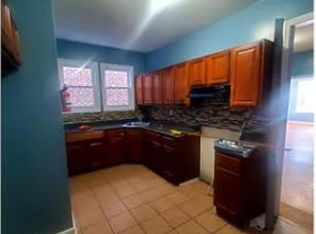
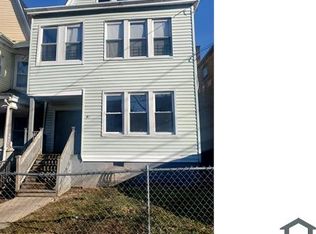
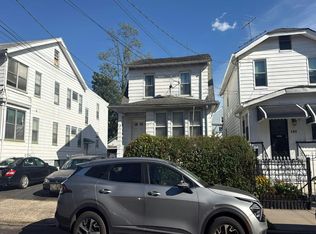
Excellent opportunity for investors and owner-occupants! Located in Newark's West Side neighborhood, this spacious two-family property offers a total of 8 bedrooms and 3 bathrooms. Unit 1 features 3 bedrooms and 1 bathroom, while Unit 2 offers 5 bedrooms and 2 bathrooms. Ideal for investors seeking rental income potential or owner-occupants looking to live in one unit while generating income from the other. Conveniently situated near West Side Park, University Hospital, local shopping, schools, and neighborhood amenities. Public transportation provides connections to Downtown Newark and NYC-bound rail service, making it appealing for commuters. Easy access to major highways adds to the convenience. Don't miss this multifamily investment opportunity!
For sale
$675,000
83 Tremont Avenue, Newark, NJ 07106
5beds
--sqft
Multi Family
Built in ----
-- sqft lot
$-- Zestimate®
$--/sqft
$-- HOA
What's special
- 15 days
- 91
- 6
Zillow last checked:
Listing updated:
Listed by:
Maikol Puebla 201-710-0598,
Coldwell Banker, Ridgewood,
Raquel Vasquez 973-277-5507,
Coldwell Banker, Ridgewood
Source: NJMLS,MLS#: 26038612
Facts & features
Interior
Bedrooms & bathrooms
- Bedrooms: 5
- Bathrooms: 3
- Full bathrooms: 3
Appliances
- Laundry: None
Property
Parking
- Total spaces: 3
Details
- Parcel number: 1404219000000007
Construction
Type & style
- Home type: MultiFamily
- Property subtype: Multi Family
Utilities & green energy
- Utilities for property: Electricity Connected, Natural Gas Connected
Community & HOA
Location
- Region: Newark
Financial & listing details
- Tax assessed value: $159,600
- Annual tax amount: $6,589
- Date on market: 10/9/2026
- Listing agreement: Exclusive Right To Sell
Estimated market value
Not available
Estimated sales range
Not available
Not available
Price history
| Date | Event | Price |
|---|---|---|
| 10/9/2026 | Listed for sale | $675,000+10.7% |
Source:  NJMLS #26038612 Report a problem | ||
| 12/19/2023 | Sold | $610,000+335.7% |
Source: Public Record Report a problem | ||
| 2/8/2022 | Listing removed | -- |
Source: Zillow Rental Network_1 Report a problem | ||
| 2/6/2022 | Listed for rent | $2,500+47.1% |
Source: Zillow Rental Network_1 Report a problem | ||
| 6/7/2020 | Listing removed | $1,700 |
Source: Go Section8 Report a problem | ||
| 5/7/2020 | Listed for rent | $1,700 |
Source: Go Section8 Report a problem | ||
| 3/26/2020 | Listing removed | $1,700 |
Source: Go Section8 Report a problem | ||
| 2/26/2020 | Listed for rent | $1,700 |
Source: Go Section8 Report a problem | ||
| 11/13/2019 | Listing removed | $1,700 |
Source: Go Section8 Report a problem | ||
| 10/9/2019 | Listed for rent | $1,700 |
Source: Go Section8 Report a problem | ||
| 8/20/2019 | Listing removed | $1,700 |
Source: Go Section8 Report a problem | ||
| 5/3/2019 | Listed for rent | $1,700 |
Source: Go Section8 Report a problem | ||
| 2/11/2019 | Listing removed | $1,700 |
Source: Go Section8 Report a problem | ||
| 1/10/2019 | Listed for rent | $1,700 |
Source: Go Section8 Report a problem | ||
| 9/26/2018 | Listing removed | $1,700 |
Source: Go Section8 Report a problem | ||
| 7/4/2018 | Listed for rent | $1,700 |
Source: Owner Report a problem | ||
| 5/20/2016 | Sold | $140,000-20.5% |
Source: Public Record Report a problem | ||
| 12/19/2006 | Sold | $176,000+131.6% |
Source: Public Record Report a problem | ||
| 6/9/2005 | Sold | $76,000 |
Source: Public Record Report a problem | ||
Public tax history
| Year | Property taxes | Tax assessment |
|---|---|---|
| 2025 | $6,382 +5.2% | $159,600 |
| 2024 | $6,070 +0.1% | $159,600 |
| 2023 | $6,065 | $159,600 |
| 2022 | $6,065 | $159,600 |
| 2021 | $6,065 +1% | $159,600 |
| 2020 | $6,003 +37.4% | $159,600 |
| 2019 | $4,367 | $159,600 |
| 2018 | $4,367 -20.5% | $159,600 |
| 2017 | $5,490 +4% | $159,600 |
| 2016 | $5,281 +6.7% | $159,600 |
| 2015 | $4,949 +5% | $159,600 |
| 2014 | $4,713 +74.8% | $159,600 +97% |
| 2012 | $2,696 +4.7% | $81,000 |
| 2011 | $2,576 -11.7% | $81,000 |
| 2010 | $2,917 +5.4% | $81,000 -23.9% |
| 2009 | $2,768 +4.4% | $106,500 |
| 2008 | $2,652 | $106,500 |
| 2007 | $2,652 | $106,500 |
| 2006 | -- | $106,500 |
| 2005 | -- | $106,500 |
| 2004 | $2,300 | $106,500 |
| 2003 | -- | $106,500 +629.5% |
| 2002 | -- | $14,600 |
| 2001 | -- | $14,600 |
Find assessor info on the county website
Monthly payment
Est. payment
Payment breakdown
Explore the cost of this home by adjusting the details. Changes won't be saved.Climate risks
Neighborhood: Lower Vailsburg


Similar homes
- $665,0006 bd3 ba-- sqft214 Smith Street, Newark, NJ 07106For Sale
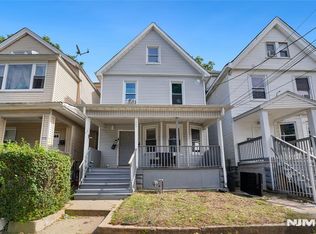
 MLS ID #26038598, Maikol Puebla, Coldwell Banker, Ridgewood. NJMLS
- $660,0005 bd3 ba19k sqft43-45 Brookdale Ave, Newark City, NJ 07106For Sale
 MLS ID #4034953, David Ledesma, Homesmart First Advantage. GSMLS
- $735,0007 bd5 ba2.2k sqft190 Smith St, Newark City, NJ 07106For Sale
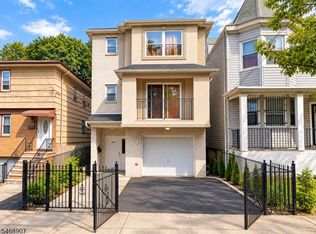 MLS ID #4060026, Yehuda Praver, Erealty Advisors, Inc.. GSMLS
- $--4 bd2 ba2.4k sqft140 Isabella Ave, Newark, NJ 07106Auction
 Auction.com 2
- $715,0008 bd3 ba-- sqft10 Howell Place, Newark, NJ 07106For SaleMLS ID #26038617, Maikol Puebla, Coldwell Banker, Ridgewood. NJMLS
- $699,0008 bd3 ba2.9k sqft45 Columbia Ave, Newark, NJ 07106For Sale
 MLS ID #2704934R, NA''IMAH MCLEOD. All Jersey MLS
- $665,0006 bd2 ba3.5k sqft360 Sanford Ave, Newark, NJ 07106For SaleMLS ID #2615227R, FAREEDA STOKES. All Jersey MLS
- $699,5007 bd3 ba-- sqft119 Isabella Avenue, Newark, NJ 07106For SaleMLS ID #26038594, Maikol Puebla, Coldwell Banker, Ridgewood. NJMLS
- $659,9997 bd4 ba-- sqft21 Gladstone Ave, Newark, NJ 07106For SaleMLS ID #2701975R, VERONICA DOUGLAS. All Jersey MLS
- $559,0007 bd3 ba-- sqft471 14th Street, Newark, NJ 07103For SaleMLS ID #26038322, Oscar Nunez-Paz, Keller Williams City Views Realty. NJMLS
- $699,5007 bd3 ba-- sqft658-660 12th Street, Newark, NJ 07103For SaleMLS ID #26038600, Maikol Puebla, Coldwell Banker, Ridgewood. NJMLS
