Fantastic investment opportunity or owner-occupant property! This spacious duplex features two well-appointed units, each offering 2 bedrooms and 1 full bathroom with comfortable living spaces and functional floor plans. A detached garage provides convenient off-street parking and additional storage. Ideally located just a few short blocks from Washington Park, residents will enjoy easy access to walking trails and a great recreation area. Whether you're looking to expand your investment portfolio or live in one unit while generating rental income from the other, this property offers outstanding potential in a desirable location. Call to schedule a showing today!
For sale
$164,900
843 S Glenwood Ave, Springfield, IL 62704
4beds
2baths
2,156sqft
Multi Family, Duplex
Built in 1900
-- sqft lot
$-- Zestimate®
$76/sqft
$-- HOA
What's special
Detached garageComfortable living spacesFunctional floor plansAdditional storageConvenient off-street parking
- 127 days
- 289
- 6
Zillow last checked:
Listing updated:
Listed by:
Barbara D Endzelis Mobl:217-971-7215,
RE/MAX Professionals,
Joseph P Endzelis,
RE/MAX Professionals
Source: RMLS Alliance as distributed by MLS GRID,MLS#: CA1044914 Originating MLS: Capital Area Association of Realtors
Facts & features
Interior
Bedrooms & bathrooms
- Bedrooms: 4
- Bathrooms: 2
Heating
- Forced Air
Cooling
- Central Air
Appliances
- Included: Gas Water Heater, Dishwasher, Range, Refrigerator, Water Heater
- Laundry: Other
Features
- Basement: Full,Unfinished
Interior area
- Total structure area: 2,156
- Total interior livable area: 2,156 sqft
Property
Parking
- Total spaces: 2
- Parking features: Detached
Lot
- Size: 4,680 Square Feet
- Dimensions: 40 x 117
- Features: Corner Lot, Level
Details
- Parcel number: 1433.0327032
Construction
Type & style
- Home type: MultiFamily
- Property subtype: Multi Family, Duplex
Materials
- Cedar
- Foundation: Brick/Mortar
- Roof: Shingle
Condition
- New construction: No
- Year built: 1900
Utilities & green energy
- Sewer: Public Sewer
- Water: Public
- Utilities for property: Cable Available
Community & HOA
Community
- Subdivision: None
Location
- Region: Springfield
Financial & listing details
- Price per square foot: $76/sqft
- Tax assessed value: $146,796
- Annual tax amount: $3,961
- Date on market: 7/6/2026
- Cumulative days on market: 131 days
- Lease term: Month To Month
- Tenant pays: Sewer, Water
- Road surface type: Paved
Estimated market value
Not available
Estimated sales range
Not available
$1,095/mo
Price history
| Date | Event | Price |
|---|---|---|
| 8/7/2026 | Price change | $164,900-2.4%$76/sqft |
Source:  RMLS Alliance as distributed by MLS GRID #CA1044914 Report a problem | ||
| 7/24/2026 | Price change | $169,000-5.6%$78/sqft |
Source: RMLS Alliance as distributed by MLS GRID #CA1044914 Report a problem | ||
| 7/6/2026 | Listed for sale | $179,000+49.3%$83/sqft |
Source: RMLS Alliance as distributed by MLS GRID #CA1044914 Report a problem | ||
| 6/6/2023 | Listing removed | -- |
Source: Zillow Rentals Report a problem | ||
| 5/25/2023 | Price change | $800-5.9% |
Source: Zillow Rentals Report a problem | ||
| 5/24/2023 | Price change | $850+6.3% |
Source: Zillow Rentals Report a problem | ||
| 5/23/2023 | Price change | $800-11.1% |
Source: Zillow Rentals Report a problem | ||
| 2/19/2023 | Price change | $900-5.3% |
Source: Zillow Rentals Report a problem | ||
| 2/2/2023 | Listed for rent | $950+59.7% |
Source: Zillow Rentals Report a problem | ||
| 7/3/2022 | Listing removed | -- |
Source:  RE/MAX International Report a problem | ||
| 6/24/2022 | Pending sale | $119,900+4.3%$56/sqft |
Source: RE/MAX International #CA1014719 Report a problem | ||
| 6/23/2022 | Sold | $115,000-4.1%$53/sqft |
Source: RMLS Alliance as distributed by MLS GRID #CA1014719 Report a problem | ||
| 6/5/2022 | Pending sale | $119,900$56/sqft |
Source: RMLS Alliance as distributed by MLS GRID #CA1014719 Report a problem | ||
| 6/4/2022 | Listed for sale | $119,900+84.5%$56/sqft |
Source: RMLS Alliance as distributed by MLS GRID #CA1014719 Report a problem | ||
| 2/13/2021 | Listing removed | -- |
Source: Owner Report a problem | ||
| 8/15/2020 | Listing removed | $595 |
Source: Owner Report a problem | ||
| 7/23/2020 | Listed for rent | $595 |
Source: Owner Report a problem | ||
| 7/16/2019 | Listing removed | $595 |
Source: Owner Report a problem | ||
| 3/13/2019 | Listed for rent | $595 |
Source: Owner Report a problem | ||
| 11/10/2014 | Sold | $65,000-7%$30/sqft |
Source: Public Record Report a problem | ||
| 10/7/2014 | Listed for sale | $69,900$32/sqft |
Source: The Real Estate Group #145382 Report a problem | ||
Public tax history
| Year | Property taxes | Tax assessment |
|---|---|---|
| 2025 | $3,962 +3.4% | $48,932 +7.2% |
| 2024 | $3,833 +4% | $45,637 +9.5% |
| 2023 | $3,685 +4% | $41,685 +5.4% |
| 2022 | $3,543 +41.7% | $39,542 +42.4% |
| 2021 | $2,500 +2% | $27,777 -0.1% |
| 2020 | $2,450 +28.3% | $27,818 +0.3% |
| 2019 | $1,910 | $27,721 +22.6% |
| 2018 | $1,910 +2.1% | $22,605 +1.3% |
| 2017 | $1,870 +2% | $22,312 +1.5% |
| 2016 | $1,834 +1% | $21,986 +1.2% |
| 2015 | $1,816 -32.4% | $21,723 +0.6% |
| 2014 | $2,687 +2.3% | $21,583 -33.4% |
| 2013 | $2,628 +2% | $32,430 |
| 2012 | $2,577 +23.5% | $32,430 |
| 2011 | $2,087 -33.3% | $32,430 -20.9% |
| 2010 | $3,130 +3% | $41,018 +1.4% |
| 2009 | $3,038 +6% | $40,436 +4.2% |
| 2008 | $2,865 -0.2% | $38,805 +3.3% |
| 2007 | $2,871 +1.6% | $37,560 +3.8% |
| 2006 | $2,826 | $36,181 |
Find assessor info on the county website
Monthly payment
Est. payment
Payment breakdown
Explore the cost of this home by adjusting the details. Changes won't be saved.Climate risks
Neighborhood: Historic West Side


Similar homes
- $190,0004 bd3 ba1.8k sqft206 S State St, Springfield, IL 62704For Sale
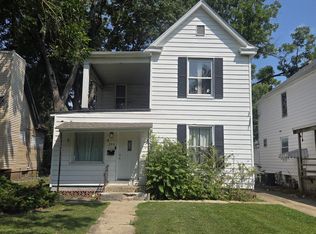
 MLS ID #CA1046545, Joshua F Kruse, The Real Estate Group, Inc.. RMLS Alliance as distributed by MLS GRID
- $155,0003 bd2 ba1.6k sqft2824 Lowell Ave, Springfield, IL 62704For Sale
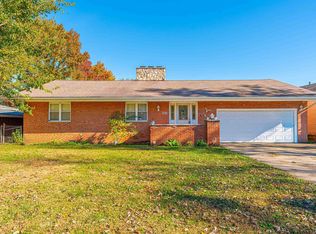 MLS ID #CA1047700, Seth A Goodman, ME Realty. RMLS Alliance as distributed by MLS GRID
- $169,9004 bd2 ba2.7k sqft452 S Grand Ave W, Springfield, IL 62704For Sale
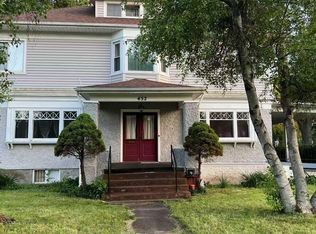 MLS ID #CA1038362, David Zhang, The Real Estate Group, Inc.. RMLS Alliance as distributed by MLS GRID
- $144,9003 bd2 ba2k sqft605 Bryn Mawr Blvd, Springfield, IL 62703For Sale
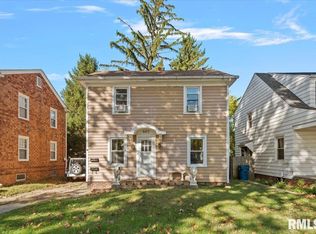 MLS ID #CA1047605, Cindy E Grady, The Real Estate Group, Inc.. RMLS Alliance as distributed by MLS GRID
- $165,0003 bd1 ba1.6k sqft1608 S Pasfield St, Springfield, IL 62704For SaleMLS ID #CA1045351, Lorri D Conn, Keller Williams Capital. RMLS Alliance as distributed by MLS GRID
- $189,9003 bd2 ba1.4k sqft2313 S Walnut St, Springfield, IL 62704For SaleMLS ID #CA1047571, Tim Frederick, Campo Realty, Inc.. RMLS Alliance as distributed by MLS GRID
- $134,0004 bd2 ba1.4k sqft2027 S College St, Springfield, IL 62704For SaleMLS ID #CA1047293, Greg Zessin, Springfield Real Estate, LLC. RMLS Alliance as distributed by MLS GRID
- $154,9003 bd2 ba1.6k sqft425 S Park Ave, Springfield, IL 62704For SaleMLS ID #CA1047288, Suzie Sables Duff, RE/MAX Professionals. RMLS Alliance as distributed by MLS GRID
- $135,0003 bd2 ba1.4k sqft715 W Canedy St, Springfield, IL 62704For SaleMLS ID #CA1047471, Matt Garrison, The Real Estate Group, Inc.. RMLS Alliance as distributed by MLS GRID
- $169,9003 bd2 ba1.5k sqft2512 S 5th St, Springfield, IL 62703For SaleMLS ID #CA1047631, Lisa A Haggerty, Keller Williams Capital. RMLS Alliance as distributed by MLS GRID
- $149,9003 bd3 ba2.1k sqft1036 W Washington St, Springfield, IL 62702For SaleMLS ID #CA1046911, Khaled Hussein, Keller Williams Capital. RMLS Alliance as distributed by MLS GRID
- $157,5003 bd2 ba1.3k sqft1000 Johnson Ln, Springfield, IL 62702For SaleMLS ID #CA1047614, Joshua F Kruse, The Real Estate Group, Inc.. RMLS Alliance as distributed by MLS GRID
- $169,9004 bd2 ba1.2k sqft1515-1517 Maryland Ave, Springfield, IL 62702For SaleMLS ID #CA1044197, Lisa A Haggerty, Keller Williams Capital. RMLS Alliance as distributed by MLS GRID
- $166,0005 bd2 ba2k sqft1812 E Converse Ave, Springfield, IL 62702For SaleMLS ID #CA1046198, Jim Fulgenzi, RE/MAX Professionals. RMLS Alliance as distributed by MLS GRID
- $130,0002 bd2 ba1.7k sqft1518 S Spring St, Springfield, IL 62704For SaleMLS ID #CA1046460, Jami R Winchester, The Real Estate Group, Inc.. RMLS Alliance as distributed by MLS GRID
- $169,0003 bd2 ba2.8k sqft1601 Cottonwood St, Springfield, IL 62703For SaleMLS ID #CA1047570, Lori A Waggener, The Real Estate Group, Inc.. RMLS Alliance as distributed by MLS GRID
- $139,0004 bd3 ba2.2k sqft600 Black Ave, Springfield, IL 62702For SaleMLS ID #CA1046183, Jennifer Coady, RE/MAX Professionals. RMLS Alliance as distributed by MLS GRID
