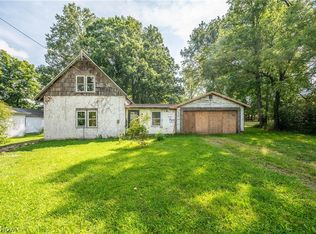
$44,600
3 bd3 ba2.2k sqft
843 Adams Ave NW, Warren, OH 44483
Off Market
Zillow last checked:
Listing updated:
Kelly L Warren 330-717-2689 kelly@kellysoldit.com,
Kelly Warren and Associates RE Solutions,
Ryan Cunningham 330-719-8262,
Kelly Warren and Associates RE Solutions
 Originating MLS: Youngstown Columbiana Association of REALTORS
Not available
Estimated sales range
Not available
Not available
| Date | Event | Price |
|---|---|---|
| 10/13/2026 | Listed for sale | $35,700-3.3%$25/sqft |
Source:  MLS Now #5252880 Report a problem | ||
| 9/7/2026 | Listing removed | $36,900$26/sqft |
Source: MLS Now #5201178 Report a problem | ||
| 4/14/2026 | Listed for sale | $36,900-7.5%$26/sqft |
Source: MLS Now #5201178 Report a problem | ||
| 3/14/2026 | Listing removed | $39,900$28/sqft |
Source: MLS Now #5156597 Report a problem | ||
| 1/5/2026 | Price change | $39,900-10.3%$28/sqft |
Source: MLS Now #5156597 Report a problem | ||
| 11/12/2025 | Price change | $44,500-6.3%$32/sqft |
Source: MLS Now #5156597 Report a problem | ||
| 9/13/2025 | Listed for sale | $47,500+90%$34/sqft |
Source: MLS Now #5156597 Report a problem | ||
| 5/10/2024 | Sold | $25,000-16.7%$18/sqft |
Source: MLS Now #4507597 Report a problem | ||
| 3/24/2024 | Pending sale | $30,000$21/sqft |
Source: MLS Now #4507597 Report a problem | ||
| 12/3/2023 | Listed for sale | $30,000$21/sqft |
Source: MLS Now #4507597 Report a problem | ||
| 12/1/2023 | Listing removed | -- |
Source: MLS Now #4462638 Report a problem | ||
| 10/6/2023 | Price change | $30,000-9.1%$21/sqft |
Source: MLS Now #4462638 Report a problem | ||
| 8/10/2023 | Price change | $33,000-5.7%$23/sqft |
Source: MLS Now #4462638 Report a problem | ||
| 7/11/2023 | Listed for sale | $35,000$25/sqft |
Source: MLS Now #4462638 Report a problem | ||
| 7/10/2023 | Pending sale | $35,000$25/sqft |
Source: MLS Now #4462638 Report a problem | ||
| 5/30/2023 | Listed for sale | $35,000+40%$25/sqft |
Source: MLS Now #4462638 Report a problem | ||
| 4/4/2023 | Sold | $25,000-16.4%$18/sqft |
Source: MLS Now #4442404 Report a problem | ||
| 3/11/2023 | Pending sale | $29,900$21/sqft |
Source: MLS Now #4442404 Report a problem | ||
| 3/6/2023 | Listed for sale | $29,900$21/sqft |
Source: MLS Now #4442404 Report a problem | ||
| Year | Property taxes | Tax assessment |
|---|---|---|
| 2025 | $293 +1.9% | $5,670 |
| 2024 | $287 -0.9% | $5,670 |
| 2023 | $290 -17.1% | $5,670 +5.2% |
| 2022 | $349 -0.2% | $5,390 |
| 2021 | $350 -0.1% | $5,390 |
| 2020 | $350 -2% | $5,390 +3.3% |
| 2019 | $357 +0.3% | $5,220 |
| 2018 | $356 +1.6% | $5,220 |
| 2017 | $351 -18.7% | $5,220 -21.5% |
| 2016 | $431 +0.6% | $6,650 |
| 2015 | $429 +0.6% | $6,650 |
| 2014 | $426 -1.4% | $6,650 -6.5% |
| 2013 | $432 +0.4% | $7,110 |
| 2012 | $431 0% | $7,110 +0.1% |
| 2011 | $431 -3.1% | $7,105 -14% |
| 2010 | $445 +0.7% | $8,260 |
| 2009 | $442 +0.6% | $8,260 |
| 2008 | $439 +5.1% | -- |
| 2007 | $417 -1.3% | -- |
| 2006 | $423 -52.5% | -- |
| 2005 | $890 +117.3% | $8,260 |
| 2004 | $410 +0% | -- |
| 2003 | $410 +14.2% | -- |
| 2002 | $359 +6% | -- |
| 2001 | $338 +0.3% | -- |
| 2000 | $337 | -- |
Source: MLS Now. This data may not be complete. We recommend contacting the local school district to confirm school assignments for this home.
A local agent can set up tours, give advice and negotiate with sellers.
A local lender can help you make sure your offer is ready when you are.