Welcome home to this beautifully maintained 3/2 single-family pool home in highly desirable Pembroke Pines! The open, spacious split floor plan flows to a private screened-in pool, perfect for year-round entertaining and enjoying the Florida lifestyle. A 2-car garage plus a wide driveway give you plenty of room for vehicles, toys, and guests.
Location, location, location! Minutes from schools, with quick access to Florida’s Turnpike and I-75 for an easy commute anywhere in South Florida. Close to Pembroke Lakes Mall, University Marketplace, Pembroke Commons, popular local restaurants, C.B. Smith Park, Hard Rock Stadium, and the Hard Rock Casino. Fort Lauderdale and Miami airports and South Florida’s beautiful beaches are only 20–30 minutes away.
Homes like this don’t last long in one of Broward County’s most sought-after communities. Pre-approval or proof of funds required for all showings. Call today to schedule your private tour!
For sale by owner
Street View
$599,000
8970 Johnson St, Pembroke Pines, FL 33024
3beds
1,864sqft
SingleFamily
Built in 1979
6,502 Square Feet Lot
$590,000 Zestimate®
$321/sqft
$-- HOA
What's special
Private screened-in poolWide driveway
- 7 hours
- 179
- 5
Listed by:
Property Owner (305) 213-9032
Facts & features
Interior
Bedrooms & bathrooms
- Bedrooms: 3
- Bathrooms: 2
- Full bathrooms: 2
Appliances
- Included: Dishwasher, Dryer, Garbage disposal, Microwave, Range / Oven, Refrigerator, Washer
Features
- Flooring: Tile, Concrete
- Has fireplace: No
Interior area
- Total interior livable area: 1,864 sqft
Property
Parking
- Parking features: Garage - Attached
Features
- Exterior features: Shingle, Stucco, Cement / Concrete
Lot
- Size: 6,502 Square Feet
Details
- Parcel number: 514117060370
Construction
Type & style
- Home type: SingleFamily
Materials
- masonry
- Foundation: Other
- Roof: Shake / Shingle
Condition
- New construction: No
- Year built: 1979
Community & HOA
Location
- Region: Pembroke Pines
Financial & listing details
- Price per square foot: $321/sqft
- Tax assessed value: $496,400
- Annual tax amount: $9,830
- Date on market: 11/17/2026
Estimated market value
$590,000
$561,000 - $620,000
$3,464/mo
Price history
| Date | Event | Price |
|---|---|---|
| 11/17/2026 | Listed for sale | $599,000-4.9%$321/sqft |
Source: Owner Report a problem | ||
| 5/14/2026 | Listing removed | $3,600$2/sqft |
Source:  MIAMI #A11998223 Report a problem | ||
| 5/11/2026 | Listing removed | $629,921$338/sqft |
Source: MIAMI #A11988081 Report a problem | ||
| 5/8/2026 | Price change | $3,600-5.3%$2/sqft |
Source: MIAMI #A11998223 Report a problem | ||
| 4/29/2026 | Price change | $3,800-5%$2/sqft |
Source: MIAMI #A11998223 Report a problem | ||
| 4/24/2026 | Price change | $629,921+5%$338/sqft |
Source: MIAMI #A11988081 Report a problem | ||
| 4/18/2026 | Listed for rent | $4,000$2/sqft |
Source: MIAMI #A11998223 Report a problem | ||
| 4/10/2026 | Price change | $599,921-9.1%$322/sqft |
Source: MIAMI #A11988081 Report a problem | ||
| 4/1/2026 | Listed for sale | $659,900+4.8%$354/sqft |
Source: MIAMI #A11988081 Report a problem | ||
| 9/18/2025 | Listing removed | $629,900$338/sqft |
Source: MIAMI #A11831322 Report a problem | ||
| 9/11/2025 | Price change | $629,900-1.6%$338/sqft |
Source: MIAMI #A11831322 Report a problem | ||
| 8/8/2025 | Price change | $639,999-3%$343/sqft |
Source: MIAMI #A11831322 Report a problem | ||
| 7/28/2025 | Price change | $659,999-1.5%$354/sqft |
Source: MIAMI #A11831322 Report a problem | ||
| 7/1/2025 | Listed for sale | $670,000+26.4%$359/sqft |
Source: MIAMI #A11831322 Report a problem | ||
| 12/11/2024 | Sold | $530,000-8.6%$284/sqft |
Source: MIAMI #A11655362 Report a problem | ||
| 10/1/2024 | Price change | $580,000-4.8%$311/sqft |
Source: MIAMI #A11655362 Report a problem | ||
| 9/18/2024 | Price change | $609,000-1%$327/sqft |
Source: MIAMI #A11655362 Report a problem | ||
| 9/9/2024 | Listed for sale | $615,000+279.6%$330/sqft |
Source: MIAMI #A11655362 Report a problem | ||
| 12/9/2011 | Sold | $162,000-50.2%$87/sqft |
Source: Public Record Report a problem | ||
| 5/23/2005 | Sold | $325,000+436.3%$174/sqft |
Source: Public Record Report a problem | ||
| 7/28/2004 | Sold | $60,600-51.1%$33/sqft |
Source: Public Record Report a problem | ||
| 4/16/2001 | Sold | $124,000$67/sqft |
Source: Public Record Report a problem | ||
| 11/29/1993 | Sold | $124,000$67/sqft |
Source: Public Record Report a problem | ||
Public tax history
| Year | Property taxes | Tax assessment |
|---|---|---|
| 2025 | $9,830 +197.6% | $496,400 +158.2% |
| 2024 | $3,303 +3.7% | $192,250 +3% |
| 2023 | $3,184 +6.5% | $186,660 +3% |
| 2022 | $2,991 +2.7% | $181,230 +3% |
| 2021 | $2,913 +1.2% | $175,960 +1.4% |
| 2020 | $2,880 +2.4% | $173,540 +2.3% |
| 2019 | $2,813 | $169,640 +1.9% |
| 2018 | $2,813 +4.2% | $166,480 +2.1% |
| 2017 | $2,700 +1.4% | $163,060 +2.1% |
| 2016 | $2,662 +0.8% | $159,710 +0.7% |
| 2015 | $2,640 -1.3% | $158,600 +0.8% |
| 2014 | $2,675 +0.3% | $157,350 -6.1% |
| 2013 | $2,667 +2.9% | $167,540 +9.9% |
| 2012 | $2,591 -0.4% | $152,440 |
| 2011 | $2,601 -8.2% | $152,440 -4.3% |
| 2010 | $2,835 -22.6% | $159,360 -22.1% |
| 2009 | $3,662 -21.1% | $204,690 -21.8% |
| 2008 | $4,644 -1.4% | $261,740 +3% |
| 2007 | $4,711 -2.8% | $254,120 +2.5% |
| 2006 | $4,847 | $247,930 +26.2% |
| 2005 | -- | $196,410 +61.8% |
| 2004 | $2,278 +0.4% | $121,420 +1.9% |
| 2003 | $2,268 +0.5% | $119,160 +2.4% |
| 2002 | $2,257 +13.4% | $116,370 +10.3% |
| 2001 | $1,990 +5.6% | $105,530 |
| 2000 | $1,886 | -- |
Find assessor info on the county website
Monthly payment
Est. payment
Payment breakdown
Explore the cost of this home by adjusting the details. Changes won't be saved.Climate risks
Neighborhood: Pasadena Lakes South
Similar homes
- $620,0004 bd2 ba2.4k sqft551 NW 99TH Way, Pembroke Pines, FL 33024For Sale
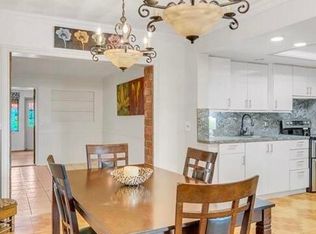
 MLS ID #B26092502, Mildred E DeRose, Costa Bella Realty Group Inc.. BeachesMLS
- $575,0003 bd2 ba1.3k sqftDriftwood Acres No 15, Hollywood, FL 33024For Sale

 MLS ID #A12046639, Laurel Davis, Majestic Realty, LLC. MIAMI
- $639,0004 bd2 ba2.1k sqftLakeside South, Hollywood, FL 33025For Sale
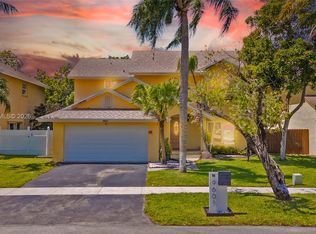 MLS ID #A12037379, Salesperson Non Member, Non-MLS Member. MIAMI
- $610,0003 bd2 ba1.7k sqftCooper Colony Estates Sec, Cooper City, FL 33328For Sale
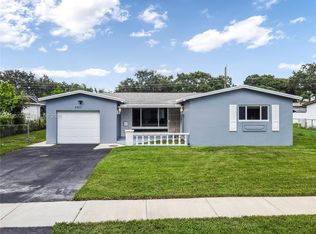 MLS ID #A12105722, Shaula Wongsam, LPT Realty, LLC. MIAMI
- $550,0003 bd2 ba1.6k sqftSouth Broward Ranches, Pembroke Pines, FL 33023For SaleMLS ID #A12088962, Juan Romero PA, DecoNova International Group. MIAMI
- $634,0003 bd3 ba2.1k sqftRiver Run Garden Homes, Hollywood, FL 33025For SaleMLS ID #A12091318, Eleazar Atencio, PAK Home Realty. MIAMI
- $550,0003 bd2 ba1.6k sqftBoulevard Heights Sec Ten, Hollywood, FL 33023For SaleMLS ID #A12109621, Kevin Marshall, Charles Rutenberg Realty FTL. MIAMI
- $610,0003 bd2 ba1.6k sqftMiramar Park Third Add, Miramar, FL 33023For SaleMLS ID #A11953418, Suresh Chiatar, Compass Florida, LLC. MIAMI
- $635,0004 bd2 ba2.6k sqftBoulevard Heights Sec Ten, Pembroke Pines, FL 33023For SaleMLS ID #A12061574, Joseph Johnson, The Keyes Company. MIAMI
- $499,9003 bd2 ba1.5k sqftBoulevard Heights Sec 3, Hollywood, FL 33024For SaleMLS ID #A12080870, Erin Marvasti, Reaction Realty Group, Inc.. MIAMI
- $649,9993 bd2 ba2k sqftCountry Sec 2, Cooper City, FL 33328For SaleMLS ID #A12046178, Patty Accorto, Keller Williams Legacy. MIAMI
- $610,0003 bd2 ba1.7k sqftJacaranda Parcel 252a, Fort Lauderdale, FL 33322For SaleMLS ID #A12117878, Laurie Reader, Keller Williams Dedicated Professionals. MIAMI
- $530,0003 bd2 ba1.9k sqftWestwood Community 5, Tamarac, FL 33321For SaleMLS ID #A12124436, Yanith Martinez PA, RE/MAX Concierge. MIAMI
- $565,0003 bd2 ba1.9k sqftPark Road Manor, Hollywood, FL 33021For SaleMLS ID #A12100618, Sandra Rathe, Real Broker LLC. MIAMI
- $597,8883 bd3 ba1.8k sqftHarbour Sub, Hialeah, FL 33015For SaleMLS ID #A12083988, Anet Ortiz, Modern World Realty. MIAMI
- $675,0003 bd2 ba1.8k sqftHollywood Hills, Hollywood, FL 33021For SaleMLS ID #A12116262, Patricia Bacen, The Keyes Company. MIAMI
- $530,0003 bd2 ba1.4k sqftLiberty Gardens, Miami Gardens, FL 33056For SaleMLS ID #A12065946, Melissa Miller, EXP Realty, LLC.. MIAMI
- $775,0003 bd2 ba1.9k sqftPembroke Lakes Sec 6, Pembroke Pines, FL 33026For SaleMLS ID #A12096496, Arturo Pino, Coldwell Banker Realty. MIAMI
- $560,0003 bd3 ba2k sqft3740 NW 23RD Place, Coconut Creek, FL 33066For SaleMLS ID #B26101101, Cleudilaine Trentini Alves, Agent Plus Realty. BeachesMLS
- $679,0003 bd2 ba1.7k sqftFlamingo Gardens-Tamarind, Cooper City, FL 33330For SaleMLS ID #A12082614, Mauricio Quintero, MQ Realty Group. MIAMI
