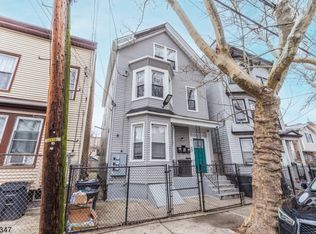
Great ValueExcellent ConditionMust See to Appreciate
Active
Price cut: $50K (10/27)
$700,000
90 Cutler St, Newark City, NJ 07104
9beds
3,000sqft
Multi Family
Built in 1900
-- sqft lot
$692,100 Zestimate®
$233/sqft
$-- HOA
What's special
- 27 days
- 181
- 6
Zillow last checked:
Listing updated:
Listed by:
Stephen Buch 908-624-1222,
Yale Kent, Llc.
Source: GSMLS,MLS#: 4057595
Facts & features
Interior
Bedrooms & bathrooms
- Bedrooms: 9
- Bathrooms: 4
- Full bathrooms: 4
Heating
- 4+ Units, Baseboard - Hotwater, Natural Gas
Cooling
- 2 Units, Built-In
Appliances
- Included: Range/Oven - Gas, Refrigerator, Gas Water Heater
Features
- See Remarks, Bedrooms, Eat-in Kitchen, Living Room, Pantry, Utility Room, Eat-In Kitchen, Kitchen
- Basement: Yes,Finished
- Has fireplace: No
Interior area
- Total structure area: 3,000
- Total interior livable area: 3,000 sqft
Property
Parking
- Parking features: None, On-Street Parking
- Has uncovered spaces: Yes
Features
- Levels: 3-Three Story
- Stories: 3
- Exterior features: Curbs, Sidewalk
Lot
- Size: 2,613 Square Feet
- Dimensions: 26 x 100
- Features: Level
Details
- Parcel number: 1614004890000000200000
Construction
Type & style
- Home type: MultiFamily
- Property subtype: Multi Family
Materials
- Vinyl Siding
- Roof: Flat,See Remarks
Condition
- Year built: 1900
- Major remodel year: 2025
Utilities & green energy
- Sewer: Public Sewer
- Water: Public
- Utilities for property: See Remarks, Garbage Included
Community & HOA
Community
- Security: Carbon Monoxide Detector(s), Smoke Detector(s), Carbon Monoxide Detector, Smoke Detector
- Subdivision: North
Location
- Region: Newark
Financial & listing details
- Price per square foot: $233/sqft
- Tax assessed value: $175,000
- Annual tax amount: $6,998
- Date on market: 10/12/2026
- Total actual rent: 5937
- Tenant pays: Electricity, Gas, Tenant Pays Heat, Tenant Pays Electric, Tenant Pays Gas
Estimated market value
$692,100
$657,000 - $727,000
$2,354/mo
Price history
| Date | Event | Price |
|---|---|---|
| 10/27/2026 | Price change | $700,000-6.7%$233/sqft |
Source:  GSMLS #4057595 Report a problem | ||
| 10/12/2026 | Listed for sale | $750,000+417.2%$250/sqft |
Source: GSMLS #4057595 Report a problem | ||
| 5/6/2023 | Listing removed | -- |
Source: Zillow Rentals Report a problem | ||
| 4/15/2023 | Listed for rent | $1,690+5.8%$1/sqft |
Source: Zillow Rentals Report a problem | ||
| 1/13/2023 | Listing removed | -- |
Source: Zillow Rentals Report a problem | ||
| 1/2/2023 | Price change | $1,597+0.1%$1/sqft |
Source: Zillow Rentals Report a problem | ||
| 12/21/2022 | Price change | $1,595-3%$1/sqft |
Source: Zillow Rentals Report a problem | ||
| 12/19/2022 | Price change | $1,645-2.9%$1/sqft |
Source: Zillow Rentals Report a problem | ||
| 12/17/2022 | Price change | $1,695-2.9%$1/sqft |
Source: Zillow Rentals Report a problem | ||
| 12/15/2022 | Price change | $1,745-2.8%$1/sqft |
Source: Zillow Rentals Report a problem | ||
| 12/12/2022 | Price change | $1,795-1.4%$1/sqft |
Source: Zillow Rentals Report a problem | ||
| 12/5/2022 | Price change | $1,820-1.4%$1/sqft |
Source: Zillow Rental Manager Report a problem | ||
| 11/23/2022 | Price change | $1,845-1.3%$1/sqft |
Source: Zillow Rental Manager Report a problem | ||
| 11/19/2022 | Price change | $1,870-1.3%$1/sqft |
Source: Zillow Rental Manager Report a problem | ||
| 11/12/2022 | Listed for rent | $1,895+40.4%$1/sqft |
Source: Zillow Rental Manager Report a problem | ||
| 9/18/2020 | Sold | $145,000-48.2%$48/sqft |
Source: Public Record Report a problem | ||
| 6/14/2020 | Listing removed | $1,350 |
Source: The Real Estate Classified Report a problem | ||
| 5/16/2020 | Listed for rent | $1,350 |
Source: The Real Estate Classified Report a problem | ||
| 4/6/2012 | Listing removed | $280,000$93/sqft |
Source: All-Ways Agency Report a problem | ||
| 6/25/2010 | Listed for sale | $280,000+260.8%$93/sqft |
Source: All-Ways Agency Report a problem | ||
| 8/3/2009 | Sold | $77,600-81.7%$26/sqft |
Source: Public Record Report a problem | ||
| 11/16/2006 | Sold | $425,000+63.5%$142/sqft |
Source: Public Record Report a problem | ||
| 4/28/2006 | Sold | $260,000+8.3%$87/sqft |
Source: Public Record Report a problem | ||
| 12/10/2002 | Sold | $240,000+77.8%$80/sqft |
Source: Public Record Report a problem | ||
| 10/30/2000 | Sold | $135,000+86.2%$45/sqft |
Source: Public Record Report a problem | ||
| 5/11/2000 | Sold | $72,500-42%$24/sqft |
Source: Public Record Report a problem | ||
| 7/23/1997 | Sold | $125,000$42/sqft |
Source: Public Record Report a problem | ||
Public tax history
| Year | Property taxes | Tax assessment |
|---|---|---|
| 2025 | $6,998 +5.2% | $175,000 |
| 2024 | $6,655 +1.8% | $175,000 |
| 2023 | $6,538 -19.6% | $175,000 |
| 2022 | $8,136 | $175,000 -18.3% |
| 2021 | $8,136 +1% | $214,100 |
| 2020 | $8,052 +37.4% | $214,100 |
| 2019 | $5,859 | $214,100 |
| 2018 | $5,859 -20.5% | $214,100 |
| 2017 | $7,365 +4% | $214,100 |
| 2016 | $7,085 +6.7% | $214,100 |
| 2015 | $6,639 +5% | $214,100 |
| 2014 | $6,322 -6.3% | $214,100 +5.6% |
| 2012 | $6,746 +4.7% | $202,700 |
| 2011 | $6,446 +16.1% | $202,700 |
| 2010 | $5,552 +5.4% | $202,700 |
| 2009 | $5,268 +4.4% | $202,700 |
| 2008 | $5,047 | $202,700 |
| 2007 | $5,047 | $202,700 |
| 2006 | -- | $202,700 |
| 2005 | -- | $202,700 |
| 2004 | $4,378 | $202,700 |
| 2003 | -- | $202,700 +2177.5% |
| 2002 | -- | $8,900 |
| 2001 | -- | $8,900 |
Find assessor info on the county website
Monthly payment
Est. payment
Payment breakdown
Explore the cost of this home by adjusting the details. Changes won't be saved.Climate risks
Neighborhood: Seventh Avenue
Nearby schools
Schools provided by the listing agent
- Elementary: Franklin
Source: GSMLS. This data may not be complete. We recommend contacting the local school district to confirm school assignments for this home.
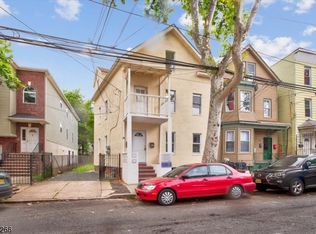
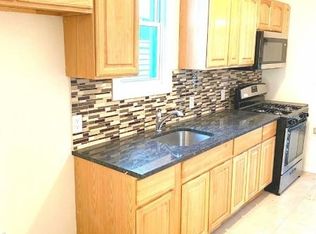
Similar homes
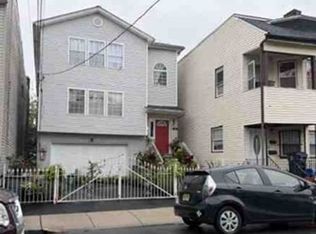
- $--6 bd4 ba3k sqft78-80 Highland Ave, Newark, NJ 07104Auction
 Xome
- $699,9987 bd6 ba3.3k sqft101 Highland Ave, Newark City, NJ 07104For Sale
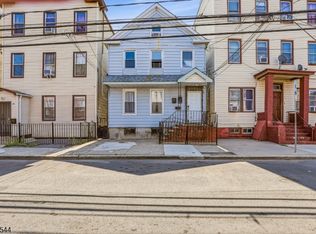 MLS ID #4043366, Kelly Robinson, Signature Realty Nj. GSMLS
- $--8 bd3 ba2.5k sqft863 S 18th St, Newark, NJ 07108Auction
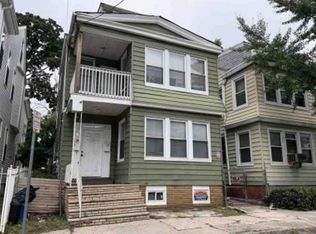 Xome
- $759,0007 bd3 ba2.6k sqft164 Parker St, Newark City, NJ 07104For Sale
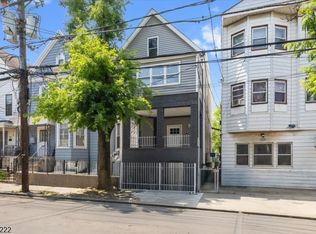 MLS ID #4033577, Jennifer Oliver-vernieri, Keller Williams Village Square. GSMLS
- $699,0008 bd3 ba2.9k sqft45 Columbia Ave, Newark, NJ 07106For Sale
 MLS ID #2704934R, NA''IMAH MCLEOD. All Jersey MLS
