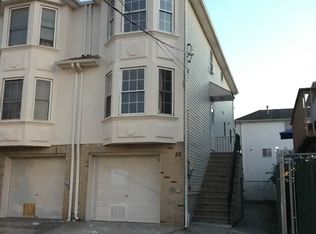
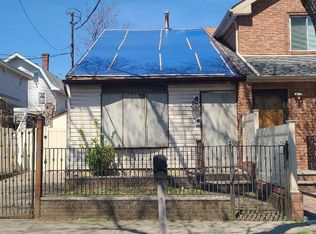
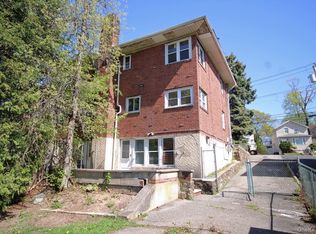
(DRIVE BY ONLY - NO ACCESS), GREAT INVESTMENT AND PRICED TO SELL. WHY RENT WHEN YOU CAN OWN A FULLY DETACHED 2 BEDROOM, 2 BATH COLONIAL, LARGE BEDROOMS, LARGE BACKYARD. LEVEL 1: LIVING RM/DIN RM, KITCHEN, BATH. LEVEL 2: 2 BEDROOMS, 3/4 BATH.
Pending
Price cut: $10K (4/1)
$375,000
90 Mapleton Ave, Staten Island, NY 10306
2beds
1,056sqft
Single Family Residence
Built in 1950
2,178 Square Feet Lot
$370,400 Zestimate®
$355/sqft
$-- HOA
What's special
Large bedroomsLarge backyard
- 134 days |
- 122 |
- 1 |
Zillow last checked:
Listing updated:
Listed by:
Robert DeFalco Realty, Inc. 718-987-7900,
Frank M. Chirichella 718-987-7900
Source: SIBOR,MLS#: 2600343
Facts & features
Interior
Bedrooms & bathrooms
- Bedrooms: 2
- Bathrooms: 2
- Full bathrooms: 1
- 3/4 bathrooms: 1
Heating
- Natural Gas, Hot Water, Other
Cooling
- Units
Appliances
- Included: Refrigerator
Features
- Basement: None
Interior area
- Total structure area: 1,056
- Total interior livable area: 1,056 sqft
Video & virtual tour
Property
Parking
- Parking features: On Street
- Has uncovered spaces: Yes
Features
- Stories: 2
- Patio & porch: Deck
- Has spa: Yes
- Spa features: Heated
- Fencing: Fenced
Lot
- Size: 2,178 Square Feet
- Dimensions: 20 x 100
- Features: Front Yard, Back Yard
Details
- Parcel number: 038100020
- Zoning: R3-1
Construction
Type & style
- Home type: SingleFamily
- Architectural style: Colonial
- Property subtype: Single Family Residence
Materials
- Aluminum Siding, Brick
Condition
- Excellent
- New construction: No
- Year built: 1950
- Major remodel year: 2012
Utilities & green energy
- Electric: 220 Volts
- Sewer: Public Sewer
Community & HOA
HOA
- Has HOA: No
Location
- Region: Staten Island
Financial & listing details
- Price per square foot: $355/sqft
- Tax assessed value: $600,000
- Annual tax amount: $1,827
- Date on market: 2/12/2026
- Listing agreement: Exclusive Right To Sell
Estimated market value
$370,400
$352,000 - $389,000
$2,770/mo
Price history
| Date | Event | Price |
|---|---|---|
| 5/20/2026 | Pending sale | $375,000$355/sqft |
Source: | ||
| 4/1/2026 | Price change | $375,000-2.6%$355/sqft |
Source: | ||
| 3/2/2026 | Price change | $385,000-3.5%$365/sqft |
Source: | ||
| 2/12/2026 | Listed for sale | $399,000$378/sqft |
Source: | ||
| 1/20/2026 | Listing removed | $399,000$378/sqft |
Source: | ||
| 1/15/2026 | Listed for sale | $399,000+8.1%$378/sqft |
Source: | ||
| 2/14/2019 | Listing removed | $369,000$349/sqft |
Source: NextHome Prestige #1122602 Report a problem | ||
| 10/5/2018 | Listed for sale | $369,000+272.7%$349/sqft |
Source: NextHome Prestige #1122602 Report a problem | ||
| 4/17/2003 | Sold | $99,000+210.9%$94/sqft |
Source: Public Record Report a problem | ||
| 3/16/1999 | Sold | $31,845$30/sqft |
Source: Public Record Report a problem | ||
Public tax history
| Year | Property taxes | Tax assessment |
|---|---|---|
| 2025 | $1,827 +5.8% | $36,000 +9.1% |
| 2024 | $1,727 | $33,000 -3.2% |
| 2023 | -- | $34,080 +21.1% |
| 2022 | -- | $28,140 -5.1% |
| 2021 | -- | $29,640 +11.5% |
| 2020 | $1,605 +5.8% | $26,580 +15.1% |
| 2019 | $1,517 | $23,100 +239.5% |
| 2018 | -- | $6,805 +5.6% |
| 2017 | $1,314 +2% | $6,447 |
| 2016 | $1,289 | $6,447 +2% |
| 2015 | $1,289 +87.3% | $6,318 +5.8% |
| 2014 | $688 | $5,971 +5.3% |
| 2013 | -- | $5,671 +5.5% |
| 2012 | -- | $5,373 |
| 2011 | -- | $5,373 +2.1% |
| 2010 | -- | $5,265 +5.8% |
| 2009 | -- | $4,976 +5.3% |
| 2008 | -- | $4,726 +5.5% |
| 2007 | -- | $4,478 |
| 2006 | -- | $4,478 +2.1% |
| 2005 | -- | $4,388 +5.8% |
| 2004 | -- | $4,147 +5.3% |
| 2003 | -- | $3,939 +5.5% |
| 2002 | -- | $3,732 |
| 2001 | -- | $3,732 +2.1% |
| 2000 | -- | $3,657 |
Find assessor info on the county website
Monthly payment
Estimated monthly payment$1,822
All calculations are estimates and provided by Zillow, Inc. for informational purposes only. Actual amounts may vary.
HOA fees may include property taxes on listings classified as Co-Ops. Contact the listing agent and/or owner for fee details.
Mortgage interest rates are dependent on a number of factors, including credit score, down payment, and repayment length. Interest rate data provided by Zillow Group Marketplace, Inc. as of 1/1/1970 from various mortgage lenders with which we have lead or other similar arrangements; the Estimated Payment is an average of those rates.
See how much you could borrow to make a competitive offer.
Climate risks
Neighborhood: Midland Beach
Nearby schools
GreatSchools rating
- 6/10Ps 38 George CromwellGrades: PK-5Distance: 0.5 mi
- 5/10Is 2 George L EgbertGrades: 6-8Distance: 0.6 mi
- 5/10New Dorp High SchoolGrades: 9-12Distance: 0.9 mi

A local agent can set up tours, give advice and negotiate with sellers.


Nearby cities
Nearby neighborhoods
Nearby zip codes
Other New York Topics
