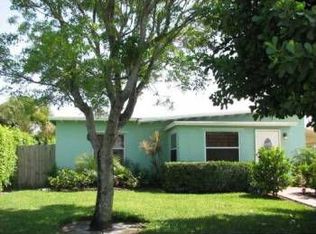
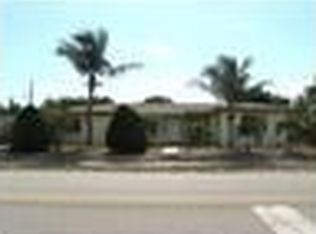
This 1900 square foot multi family home has 4 bedrooms and 2.0 bathrooms. This home is located at 902 S Seacrest Blvd, Boynton Beach, FL 33435.
Foreclosed
Street View
Est. $398,000
902 S Seacrest Blvd, Boynton Beach, FL 33435
4beds
2baths
1,900sqft
MultiFamily
Built in 1980
-- sqft lot
$398,000 Zestimate®
$209/sqft
$-- HOA
Overview
- 54 days
- 29
- 3
Facts & features
Interior
Bedrooms & bathrooms
- Bedrooms: 4
- Bathrooms: 2
Heating
- Forced air
Cooling
- Central
Features
- Flooring: Carpet
Interior area
- Total interior livable area: 1,900 sqft
Property
Features
- Exterior features: Stucco
Lot
- Size: 0.27 Acres
Details
- Parcel number: 08434528120200110
Construction
Type & style
- Home type: MultiFamily
Materials
- masonry
- Roof: Asphalt
Condition
- Year built: 1980
Community & HOA
Location
- Region: Boynton Beach
Financial & listing details
- Price per square foot: $209/sqft
- Tax assessed value: $391,681
- Annual tax amount: $7,540
Foreclosure details
Estimated market value
$398,000
$334,000 - $474,000
$2,641/mo
Price history
| Date | Event | Price |
|---|---|---|
| 8/27/2026 | Sold | $200,100+700.4%$105/sqft |
Source: Public Record Report a problem | ||
| 6/10/2026 | Sold | $25,000$13/sqft |
Source: Public Record Report a problem | ||
Public tax history
| Year | Property taxes | Tax assessment |
|---|---|---|
| 2025 | $7,540 +1.1% | $332,195 +10% |
| 2024 | $7,460 +7.1% | $301,995 +10% |
| 2023 | $6,964 +12.1% | $274,541 +10% |
| 2022 | $6,215 +13.5% | $249,583 +10% |
| 2021 | $5,474 +4% | $226,894 +10% |
| 2020 | $5,266 +6% | $206,267 +10% |
| 2019 | $4,970 | $187,515 -9.4% |
| 2018 | $4,970 +16.5% | $206,891 +3.7% |
| 2017 | $4,266 +5.4% | $199,531 +41.6% |
| 2016 | $4,047 +11.7% | $140,883 +10% |
| 2015 | $3,623 +19.3% | $128,075 +10% |
| 2014 | $3,036 +8.4% | $116,432 +9.1% |
| 2013 | $2,800 +4.7% | $106,766 +5.3% |
| 2012 | $2,673 -11% | $101,356 -12.5% |
| 2011 | $3,005 -4.5% | $115,840 -7.8% |
| 2010 | $3,147 -17.9% | $125,666 -22.2% |
| 2009 | $3,832 -20.4% | $161,538 -28.4% |
| 2008 | $4,812 -9.7% | $225,627 -11.9% |
| 2007 | $5,329 -7.4% | $256,086 +1% |
| 2006 | $5,752 | $253,482 +39.5% |
| 2005 | -- | $181,755 +41.2% |
| 2004 | $1,873 +885.8% | $128,729 -0.7% |
| 2003 | $190 -93.9% | $129,669 +10.1% |
| 2002 | $3,140 +36.1% | $117,731 +31.7% |
| 2001 | $2,306 +3.7% | $89,412 +3% |
| 2000 | $2,224 +14.6% | $86,843 +8.8% |
| 1999 | $1,941 | $79,830 |
Find assessor info on the county website
Monthly payment
Climate risks
Neighborhood: Bowers Park

Similar homes
- $410,0003 bd3 ba1.1k sqftMc Donald Park, Boynton Beach, FL 33435For Sale

 MLS ID #A12100237, Jose Medina Jr, Main Assets Corp. MIAMI
- $399,0004 bd3 ba1.2k sqft412 NE 2nd Street, Boynton Beach, FL 33435For Sale

 MLS ID #B26065046, Chelsea Loiseau, Compass Florida LLC. BeachesMLS
- $375,0004 bd1 ba1.3k sqft219 NE 6th Avenue, Boynton Beach, FL 33435For Sale
 MLS ID #B26081653, Chelsea Loiseau, Compass Florida LLC. BeachesMLS
- $379,9993 bd2 ba1.6k sqft207 NE 6th Avenue, Boynton Beach, FL 33435For Sale
 MLS ID #B26079585, Tiwana D Holmes, Preferred Properties Int'l Rea. BeachesMLS
- $380,0003 bd2 ba1.2k sqftHappy Home Heights, Boynton Beach, FL 33435For SaleMLS ID #A12106981, Karen Albright, Opendoor Brokerage LLC. MIAMI
- $580,0003 bd2 ba1.7k sqft2867 SE 1st Court, Boynton Beach, FL 33435For SaleMLS ID #B26090572, Alexander Paul Karram, United Realty Group, Inc. BeachesMLS
- $424,9003 bd4 ba2.2k sqft1203 Coastal Bay Boulevard, Boynton Beach, FL 33435For SaleMLS ID #B26080651, Lauren Blosser, Compass Florida LLC. BeachesMLS
- $500,0003 bd2 ba1.3k sqft120 NW 4TH Avenue, Boynton Beach, FL 33435For SaleMLS ID #B26089067, Jonathan Robles, The Agency Florida LLC. BeachesMLS
- $514,0004 bd3 ba1.4k sqft915 SW 3RD Street, Boynton Beach, FL 33435For SaleMLS ID #B26071858, Chelsea Loiseau, Compass Florida LLC. BeachesMLS
- $499,0003 bd2 ba1.3k sqft433 SW 10TH Avenue, Boynton Beach, FL 33435For SaleMLS ID #B26078723, Brice Mentor, Home Master Realty LLC. BeachesMLS
- $359,0003 bd2 ba1.2k sqft1, Boynton Beach, FL 33435For SaleMLS ID #B26087090, Elizabeth Roe, Kroll Realty. BeachesMLS
- $589,0004 bd2 ba2k sqft310 SW 1st Avenue, Boynton Beach, FL 33435For SaleMLS ID #B26045100, Daniel Mills, Prestige Properties Group LLC. BeachesMLS
- $439,9002 bd4 ba2.1k sqft1403 Coastal Bay Boulevard, Boynton Beach, FL 33435For SaleMLS ID #B26066810, Karen E Cusenza, RE/MAX Direct. BeachesMLS
- $580,0003 bd2 ba1.8k sqft334 SW 13th Avenue, Boynton Beach, FL 33435For SaleMLS ID #B26010061, William S Harris, Keller Williams Dedicated Professionals. BeachesMLS
- $460,0002 bd2 ba1.1k sqftCasa Costa, Boynton Beach, FL 33435For SaleMLS ID #B26039171, Luis Leandro Lopez Campos, Keller Williams Realty Service. BeachesMLS
- $395,0002 bd2 ba2.2k sqft700 Canal Way, Boynton Beach, FL 33426For SaleMLS ID #R11165620, Nicholas Claude Casamassimo, Casa Ott Realty. BeachesMLS
- $499,0003 bd2 ba2k sqft524 NW 9th Avenue, Boynton Beach, FL 33435For SaleMLS ID #B26079759, Barbara Husted, Realty One Group Innovation. BeachesMLS
- $400,0002 bd2 ba1k sqftCasa Costa, Boynton Beach, FL 33435For SaleMLS ID #A12067694, Michell Tapia, LoKation. MIAMI
- $510,0004 bd4 ba2k sqftBoynton Heights, Boynton Beach, FL 33435For SaleMLS ID #A12056540, Dean Ismajli, Coldwell Banker. MIAMI
- $385,0002 bd2 ba1.5k sqft105 NW 8TH Place, Boynton Beach, FL 33426For SaleMLS ID #B26063445, Alla Trost, Agent Plus Realty. BeachesMLS
