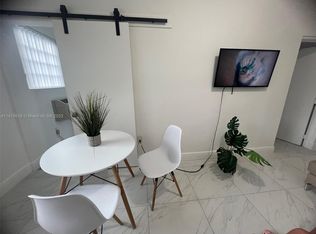
Income-producing fourplex in Miami Beach featuring a new roof and all four units occupied and generating rental income! Parking space available in front of the property, with additional street parking available. The property offers a backyard currently enjoyed as a shared outdoor space, with flexibility to designate areas for individual units. Existing backyard connections for a coin-operated washer and dryer offer potential for additional income; machines are not currently installed. A great opportunity to acquire an established rental property with a new roof and potential to enhance its income.
For sale
$1,379,000
903 80th St, Miami Beach, FL 33141
8beds
5baths
2,685sqft
Quadruplex
Built in 1950
-- sqft lot
$-- Zestimate®
$514/sqft
$-- HOA
What's special
New roofAdditional street parking available
- 19 days
- 225
- 20
Likely to sell faster than
Zillow last checked:
Listing updated:
Listed by:
Rachel Gonzalez 786-318-7583,
Top Tier International Realty, LLC.
Source: MIAMI,MLS#: A12106430 Originating MLS: A-Miami Association of REALTORS
Facts & features
Interior
Bedrooms & bathrooms
- Bedrooms: 8
- Bathrooms: 5
Heating
- None
Cooling
- Ceiling Fan(s), Wall/Window Unit(s)
Features
- Flooring: Tile
Interior area
- Total structure area: 2,827
- Total interior livable area: 2,685 sqft
Video & virtual tour
Property
Parking
- Total spaces: 4
Features
- Stories: 1
Lot
- Features: Less Than 1/4 Acre Lot
Details
- Parcel number: 0232020080770
- Zoning: 3900
Construction
Type & style
- Home type: MultiFamily
- Property subtype: Quadruplex
Materials
- Concrete Block Construction
- Roof: Shingle
Condition
- Year built: 1950
Utilities & green energy
- Sewer: Public Sewer
Community & HOA
Community
- Subdivision: Biscayne Bch Sub
HOA
- Has HOA: No
Location
- Region: Miami Beach
Financial & listing details
- Price per square foot: $514/sqft
- Tax assessed value: $787,619
- Annual tax amount: $14,480
- Date on market: 10/15/2026
- Listing terms: Conventional,1031 Exchange,FHA,VA Loan
Estimated market value
Not available
Estimated sales range
Not available
Not available
Price history
| Date | Event | Price |
|---|---|---|
| 10/15/2026 | Listed for sale | $1,379,000+1.4%$514/sqft |
Source:  MIAMI #A12106430 Report a problem | ||
| 6/27/2026 | Listing removed | $1,360,000$507/sqft |
Source: MIAMI #A11970930 Report a problem | ||
| 3/8/2026 | Price change | $1,360,000-0.4%$507/sqft |
Source: MIAMI #A11970930 Report a problem | ||
| 2/24/2026 | Listed for sale | $1,365,000-9%$508/sqft |
Source: MIAMI #A11970930 Report a problem | ||
| 11/14/2025 | Listing removed | $1,500,000$559/sqft |
Source: MIAMI #A11895583 Report a problem | ||
| 10/20/2025 | Listed for sale | $1,500,000+3.5%$559/sqft |
Source: MIAMI #A11895583 Report a problem | ||
| 6/1/2025 | Listing removed | $1,449,000$540/sqft |
Source: MIAMI #A11756937 Report a problem | ||
| 3/12/2025 | Price change | $1,449,000-13.5%$540/sqft |
Source: MIAMI #A11756937 Report a problem | ||
| 3/5/2025 | Listed for sale | $1,675,000+63.4%$624/sqft |
Source: MIAMI #A11756937 Report a problem | ||
| 1/31/2025 | Sold | $1,025,000-10.9%$382/sqft |
Source: Public Record Report a problem | ||
| 11/1/2024 | Pending sale | $1,150,000+597%$428/sqft |
Source: MIAMI #A11596070 Report a problem | ||
| 10/23/2024 | Sold | $165,000-85.7%$61/sqft |
Source: MIAMI #A11596070 Report a problem | ||
| 10/4/2024 | Contingent | $1,150,000$428/sqft |
Source: MIAMI #A11596070 Report a problem | ||
| 9/19/2024 | Listed for sale | $1,150,000$428/sqft |
Source: MIAMI #A11596070 Report a problem | ||
| 8/24/2024 | Pending sale | $1,150,000$428/sqft |
Source: MIAMI #A11596070 Report a problem | ||
| 8/1/2024 | Price change | $1,150,000-4.2%$428/sqft |
Source: MIAMI #A11596070 Report a problem | ||
| 6/20/2024 | Price change | $1,200,000-4%$447/sqft |
Source: MIAMI #A11596070 Report a problem | ||
| 5/29/2024 | Listed for sale | $1,250,000+33.7%$466/sqft |
Source: MIAMI #A11596070 Report a problem | ||
| 11/4/2021 | Sold | $935,000-2.6%$348/sqft |
Source: MIAMI #A11090186 Report a problem | ||
| 10/15/2021 | Contingent | $960,000+48.8%$358/sqft |
Source: MIAMI #A11090186 Report a problem | ||
| 6/3/2019 | Sold | $645,000-5.1%$240/sqft |
Source: Public Record Report a problem | ||
| 3/23/2019 | Pending sale | $680,000$253/sqft |
Source: Opes Real Estate Group #A10588897 Report a problem | ||
| 3/12/2019 | Price change | $680,000-2.9%$253/sqft |
Source: Opes Real Estate Group #A10588897 Report a problem | ||
| 12/20/2018 | Listed for sale | $700,000-1.4%$261/sqft |
Source: Opes Real Estate Group #A10588897 Report a problem | ||
| 8/25/2018 | Listing removed | $710,000+41.3%$264/sqft |
Source: Decorus Realty LLC #A10458118 Report a problem | ||
| 3/10/2017 | Sold | $502,500-9.9%$187/sqft |
Source: Public Record Report a problem | ||
| 10/28/2014 | Sold | $557,500+346%$208/sqft |
Source: Public Record Report a problem | ||
| 10/7/1997 | Sold | $125,000-21.9%$47/sqft |
Source: Public Record Report a problem | ||
| 7/26/1995 | Sold | $160,000+32.2%$60/sqft |
Source: Public Record Report a problem | ||
| 4/21/1994 | Sold | $121,000$45/sqft |
Source: Public Record Report a problem | ||
Public tax history
| Year | Property taxes | Tax assessment |
|---|---|---|
| 2025 | $14,776 +1.3% | $787,619 +2.5% |
| 2024 | $14,582 +12.1% | $768,552 +11.7% |
| 2023 | $13,006 +0.6% | $688,242 0% |
| 2022 | $12,932 +75.2% | $688,244 +80.1% |
| 2021 | $7,380 -26% | $382,217 -25.9% |
| 2020 | $9,980 +29.7% | $515,481 +29.8% |
| 2019 | $7,694 +10.9% | $397,029 +7.6% |
| 2018 | $6,936 | $368,838 +7.3% |
| 2017 | $6,936 +0.2% | $343,703 +10% |
| 2016 | $6,919 +22.9% | $312,458 +10% |
| 2015 | $5,628 +52.8% | $284,053 +145.9% |
| 2014 | $3,683 +23.3% | $115,506 +10% |
| 2013 | $2,986 | $105,006 +10% |
| 2012 | $2,986 +66.2% | $95,460 +10% |
| 2011 | $1,796 -30.9% | $86,782 -26.4% |
| 2010 | $2,601 -64.2% | $117,860 -66.6% |
| 2009 | $7,269 -18.3% | $353,356 -19.9% |
| 2007 | $8,896 +26.1% | $440,933 |
| 2006 | $7,055 | -- |
| 2005 | $7,055 +31.6% | -- |
| 2004 | $5,361 +45.6% | -- |
| 2003 | $3,682 +32.1% | -- |
| 2002 | $2,787 | -- |
| 2001 | $2,787 | -- |
Find assessor info on the county website
Monthly payment
Est. payment
Payment breakdown
Explore the cost of this home by adjusting the details. Changes won't be saved.Climate risks
Neighborhood: Biscayne Point


Similar homes
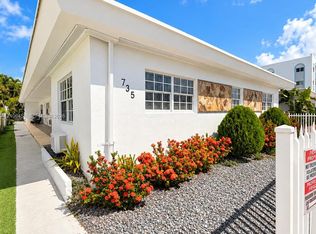
- $1,389,9007 bd4 ba3.4k sqftBiscayne Bch Sub, Miami Beach, FL 33141For Sale
 MLS ID #A12106458, Rachel Gonzalez, Top Tier International Realty, LLC.. MIAMI
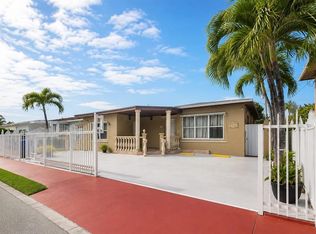
- $1,500,0006 bd4 ba2.7k sqft955 79TH TERRACE, MIAMI BEACH, FL 33141For Sale
 MLS ID #OM728829, Rosario Cornman, LPT REALTY, LLC. Stellar MLS
- $1,389,0006 bd4 ba3k sqftIsle Of Normandy Miami Vi, Miami Beach, FL 33141For Sale
 MLS ID #A12066078, Sergio Evora, London Foster Realty. MIAMI
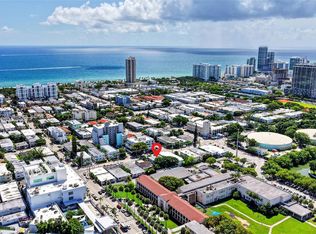
- $1,600,0006 bd4 ba3.6k sqftAltos Del Mar No 3, Miami Beach, FL 33141For Sale
 MLS ID #A12092788, Karen Gomez, Real Estate Sales Force. MIAMI
- $1,810,0008 bd4 ba3.8k sqftIsle Of Normandy Miami Vi, Miami Beach, FL 33141For SaleMLS ID #A11987767, Marilina Apfelbaum, Beachfront Realty Inc. MIAMI
- $1,700,0006 bd5 ba3.4k sqftIsle Of Normandy Miami Vi, Miami Beach, FL 33141For SaleMLS ID #A12039498, Enrique Metauten, EXP Realty LLC. MIAMI
- $1,450,0007 bd5 ba1.9k sqftBiscayne Shores Corr Plat, Miami, FL 33161For SaleMLS ID #A12071638, Samir Dichy, Casa USA Brokers. MIAMI
- $950,0005 bd3 ba1.9k sqftBaywood, Miami, FL 33138For SaleMLS ID #A12115406, Eli Nektalov, Big International Realty, Inc.. MIAMI
- $1,399,0006 bd7 ba3k sqftBuena Vista Heights Exten, Miami, FL 33127For SaleMLS ID #A11621180, Claudienne Hibbert, EXP Realty LLC. MIAMI
- $1,500,0008 bd4 ba3.6k sqftSanta Clara Sub, Miami, FL 33127For SaleMLS ID #A12073273, Miguel Fuentes, Fausto Commercial Realty Consultants Inc. MIAMI
- $1,399,0008 bd8 ba3.8k sqftHollywood, Hollywood, FL 33020For SaleMLS ID #A12078278, Elior Levi, Fausto Commercial Realty Consultants Inc. MIAMI
- $1,455,0008 bd4 ba2.7k sqftWestmoor, Miami, FL 33145For SaleMLS ID #A12038854, Julio Hernandez, Select International Realty, LLC.. MIAMI
- $1,060,0008 bd4 ba2.8k sqftSanta Clara Sub, Miami, FL 33127For SaleMLS ID #A12111012, Benjamin Lipson, Icon Realty Brokerage, LLC. MIAMI
- $1,370,0006 bd6 ba1.6k sqftCarver Ranches, Hollywood, FL 33021For SaleMLS ID #A12109201, Cecilia Cuello, First Pro International Rlty. MIAMI
- $1,299,0007 bd6 ba3k sqftSusan Gardens, Hialeah, FL 33013For SaleMLS ID #A11631258, Joshua Mendoza, JM & Associates Realty Inc. MIAMI
- $1,449,0008 bd4 ba2.7k sqftCity Of Miami South, Miami, FL 33130For SaleMLS ID #A11952416, Monica Malpica, LPT Realty, LLC. MIAMI
- $1,070,0008 bd4 ba3.5k sqftOrchard Villa Extension, Miami, FL 33142For SaleMLS ID #A12052741, Johana Parra, Realty One Group Evolution. MIAMI
- $1,300,0005 bd5 ba2.8k sqftLawrence Estate Land Co, Miami, FL 33125For SaleMLS ID #A11864674, Maritza Gonzalez, Florida Capital Realty. MIAMI
- $1,298,0005 bd4 ba2.4k sqftGrapeland, Miami, FL 33145For SaleMLS ID #A12052250, Luiza Renuart, Elite Ocean View Realty LLC. MIAMI
- $975,0008 bd5 ba2.2k sqftBuena Vista Gardens, Miami, FL 33127For SaleMLS ID #A12088467, Marsha Edwards, LoKation. MIAMI
