SOLID AND CONVENIENT HOME - This home nestled in the quiet but convenient Forest Hills subdivision, has terrazzo floors through out and is convenient to Downtown shopping and the VA Hospital. The traditional floor plan has three bedrooms 2 baths, a garage that is converted to a workshop. Come and see this charmer.
For sale
$200,000
918 SE Lantana Loop, Lake City, FL 32025
3beds
1,550sqft
Single Family Residence
Built in 1960
0.35 Acres Lot
$-- Zestimate®
$129/sqft
$-- HOA
What's special
- 589 days
- 464
- 25
Zillow last checked:
Listing updated:
Listed by:
Nate A Sweat 386-628-1552,
Magnolia Real Estate Group of North FL LLC 386-628-1552
Source: NFMLS,MLS#: 126685
Facts & features
Interior
Bedrooms & bathrooms
- Bedrooms: 3
- Bathrooms: 2
- Full bathrooms: 2
Rooms
- Room types: Kitchen, Family Room, Living Room
Heating
- Central Gas
Cooling
- Central Air
Appliances
- Included: Refrigerator, Electric Range, Cooktop, Range Hood
- Laundry: Laundry Room, Inside
Features
- Ceiling Fan(s), High Speed Internet
- Flooring: Other
- Windows: Aluminum Frames, Blinds
Interior area
- Total structure area: 1,550
- Total interior livable area: 1,550 sqft
Property
Parking
- Total spaces: 1
- Parking features: 1 Car, Carport
- Carport spaces: 1
Features
- Levels: One
- Patio & porch: Front Porch
- Fencing: Wood
Lot
- Size: 0.35 Acres
Details
- Additional structures: Shed(s)
- Parcel number: 00000007740000
- Zoning: SFR
Construction
Type & style
- Home type: SingleFamily
- Property subtype: Single Family Residence
Materials
- Brick Vinyl Siding
- Foundation: Slab
- Roof: Metal
Condition
- New construction: No
- Year built: 1960
Utilities & green energy
- Sewer: Public Sewer
- Water: Public
- Utilities for property: Cable Available
Community & HOA
Community
- Features: City Limits
HOA
- Has HOA: No
Location
- Region: Lake City
Financial & listing details
- Price per square foot: $129/sqft
- Tax assessed value: $157,237
- Annual tax amount: $3,196
- Date on market: 4/9/2025
- Road surface type: Paved
Estimated market value
Not available
Estimated sales range
Not available
Not available
Price history
| Date | Event | Price |
|---|---|---|
| 10/27/2026 | Listed for rent | $1,600-5.9%$1/sqft |
Source: Zillow Rentals Report a problem | ||
| 3/12/2026 | Listing removed | $1,700$1/sqft |
Source: Zillow Rentals Report a problem | ||
| 2/12/2026 | Listed for rent | $1,700+13.3%$1/sqft |
Source: Zillow Rentals Report a problem | ||
| 1/8/2026 | Listed for sale | $200,000$129/sqft |
Source:  NFMLS #126685 Report a problem | ||
| 1/1/2026 | Listing removed | $200,000$129/sqft |
Source: NFMLS #126685 Report a problem | ||
| 10/18/2025 | Price change | $200,000-8.9%$129/sqft |
Source: NFMLS #126685 Report a problem | ||
| 6/13/2025 | Price change | $219,500-0.2%$142/sqft |
Source: NFMLS #126685 Report a problem | ||
| 4/9/2025 | Listed for sale | $220,000+41.9%$142/sqft |
Source: NFMLS #126685 Report a problem | ||
| 10/20/2023 | Listing removed | -- |
Source: Zillow Rentals Report a problem | ||
| 10/10/2023 | Listed for rent | $1,500$1/sqft |
Source: Zillow Rentals Report a problem | ||
| 10/20/2022 | Listing removed | -- |
Source: Zillow Rental Manager Report a problem | ||
| 10/8/2022 | Listed for rent | $1,500$1/sqft |
Source: Zillow Rental Manager Report a problem | ||
| 8/5/2020 | Sold | $155,000+106.7%$100/sqft |
Source: Public Record Report a problem | ||
| 3/21/2019 | Sold | $75,000-16.2%$48/sqft |
Source: Public Record Report a problem | ||
| 2/14/2019 | Price change | $89,500-10.4%$58/sqft |
Source: RESULTS REALTY OF NORTHERN FL INC #103104 Report a problem | ||
| 1/22/2019 | Price change | $99,900-9.2%$64/sqft |
Source: RESULTS REALTY OF NORTHERN FL INC #103104 Report a problem | ||
| 1/2/2019 | Listed for sale | $110,000+109.5%$71/sqft |
Source: RESULTS REALTY OF NORTHERN FL INC #103104 Report a problem | ||
| 10/15/2018 | Sold | $52,500-8.5%$34/sqft |
Source: Public Record Report a problem | ||
| 8/3/2001 | Sold | $57,400-8.2%$37/sqft |
Source: Public Record Report a problem | ||
| 1/31/2000 | Sold | $62,500$40/sqft |
Source: Public Record Report a problem | ||
Public tax history
| Year | Property taxes | Tax assessment |
|---|---|---|
| 2025 | $3,196 +5% | $157,237 +5.9% |
| 2024 | $3,043 +877.7% | $148,469 +36.7% |
| 2023 | $311 +23.5% | $108,641 +3% |
| 2022 | $252 | $105,477 +3% |
| 2021 | $252 -85.8% | $102,405 +29.5% |
| 2020 | $1,779 -7.4% | $79,083 -2.9% |
| 2019 | $1,921 | $81,440 +5.2% |
| 2018 | $1,921 +662.4% | $77,404 +3.8% |
| 2017 | $252 | $74,542 +0.8% |
| 2016 | $252 +9.3% | $73,969 +16.2% |
| 2015 | $231 | $63,649 +0.8% |
| 2014 | $231 | $63,144 +1.5% |
| 2013 | -- | $62,211 +0.4% |
| 2012 | -- | $61,971 +3% |
| 2011 | -- | $60,166 +1.5% |
| 2010 | -- | $59,277 +2.7% |
| 2009 | -- | $57,719 +0.1% |
| 2008 | -- | $57,661 +3% |
| 2007 | -- | $55,982 +2.5% |
| 2006 | -- | $54,617 +3% |
| 2005 | -- | $53,026 +3% |
| 2004 | -- | $51,482 +1.9% |
| 2003 | -- | $50,522 +2.4% |
| 2002 | -- | $49,338 +1.6% |
| 2001 | -- | $48,561 +13.6% |
| 2000 | -- | $42,763 |
Find assessor info on the county website
Monthly payment
Est. payment
Payment breakdown
Explore the cost of this home by adjusting the details. Changes won't be saved.Climate risks
Neighborhood: 32025
- $241,5004 bd2 ba1.8k sqft910 SE Lantana Loop, Lake City, FL 32025Off Market

- $206,3003 bd2 ba1.7k sqft924 SE Lantana Loop, Lake City, FL 32025Off Market

- $197,6003 bd2 ba1.6k sqft905 SE Division Ave, Lake City, FL 32025Off Market
- $229,9003 bd3 ba2.4k sqft411 SE Evergreen Dr, Lake City, FL 32025Off Market

Similar homes
- $180,0003 bd2 ba1k sqft210 SW Elizabeth Ct, Lake City, FL 32025For Sale
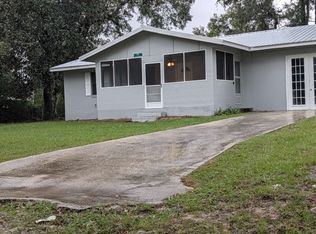 MLS ID #134175, John Stewart, THE DARBY-ROGERS CO.. NFMLS
- $199,0003 bd1 ba1.3k sqft1115 SW Old Dogwood Ter, Lake City, FL 32025For Sale
 MLS ID #133903, Missy Zecher, REMAX Select Group. NFMLS
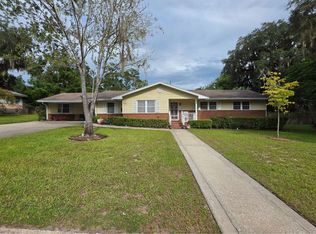
- $245,5003 bd2 ba1.7k sqft957 SE Division Ave, Lake City, FL 32025For Sale
 MLS ID #133234, Angela Cox, STAN BATTEN REAL ESTATE, INC.. NFMLS
- $195,0003 bd1 ba1.6k sqft412 S Marion Ave, Lake City, FL 32025For Sale
 MLS ID #131317, Evan Crapps, DANIEL CRAPPS AGENCY, INC. NFMLS
- $219,0003 bd2 ba1.5k sqft294 SE TRIBBLE STREET, LAKE CITY, FL 32025For Sale
 MLS ID #G5115484, Amanda Harrison, HARRISON REAL PROPERTY GROUP. Stellar MLS
- $168,0004 bd3 ba1.5k sqft173 SE ANDREWS DRIVE, LAKE CITY, FL 32025For SaleMLS ID #TB8535348, Nehad Darwish, DIVINE ESTATES REALTY LLC. Stellar MLS
- $259,9003 bd2 ba1.6k sqft863 SE DEFENDER DRIVE, LAKE CITY, FL 32025For SaleMLS ID #GC544167, Thomas Mastin, BOSSHARDT REALTY SERVICES LLC. Stellar MLS
