This 1473 square foot single family home has 3 bedrooms and 2.0 bathrooms. This home is located at 9228 Walnut St, Oakland, CA 94603.
Pre-foreclosure
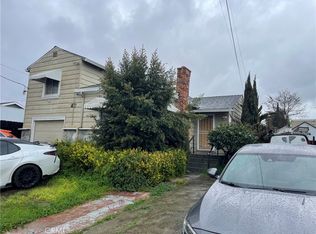
Street View
Est. $638,600
9228 Walnut St, Oakland, CA 94603
3beds
2baths
1,473sqft
SingleFamily
Built in 1924
5,532 Square Feet Lot
$638,600 Zestimate®
$434/sqft
$-- HOA
Overview
- 66 days |
- 11 |
- 0 |
Facts & features
Interior
Bedrooms & bathrooms
- Bedrooms: 3
- Bathrooms: 2
Interior area
- Total interior livable area: 1,473 sqft
Property
Parking
- Parking features: Garage - Attached
Lot
- Size: 5,532 Square Feet
Details
- Parcel number: 46543426
Construction
Type & style
- Home type: SingleFamily
Materials
- wood frame
Condition
- Year built: 1924
Community & HOA
Location
- Region: Oakland
Financial & listing details
- Price per square foot: $434/sqft
- Tax assessed value: $591,043
Visit our professional directory to find a foreclosure specialist in your area that can help with your home search.
Find a foreclosure agentForeclosure details
Estimated market value
$638,600
$568,000 - $702,000
$3,553/mo
Price history
| Date | Event | Price |
|---|---|---|
| 9/14/2007 | Sold | $450,000+309.1%$305/sqft |
Source: Public Record Report a problem | ||
| 5/25/1999 | Sold | $110,000$75/sqft |
Source: Public Record Report a problem | ||
Public tax history
| Year | Property taxes | Tax assessment |
|---|---|---|
| 2025 | -- | $591,043 +2% |
| 2024 | $10,535 -7.1% | $579,455 +2% |
| 2023 | $11,346 +10.9% | $568,097 +2% |
| 2022 | $10,232 +7.6% | $556,960 +2% |
| 2021 | $9,509 +1.7% | $546,043 +1% |
| 2020 | $9,349 +9.4% | $540,444 +2% |
| 2019 | $8,548 +22.5% | $529,851 +2% |
| 2018 | $6,979 | $519,465 +20.8% |
| 2017 | $6,979 +5.1% | $430,000 +3.6% |
| 2016 | $6,639 +73.2% | $415,000 +18.6% |
| 2015 | $3,833 | $350,000 +105.9% |
| 2014 | $3,833 | $170,000 +24.1% |
| 2013 | -- | $137,000 +24.5% |
| 2012 | -- | $110,000 -8.3% |
| 2011 | -- | $120,000 -7% |
| 2010 | -- | $129,000 |
| 2009 | -- | $129,000 -66.1% |
| 2008 | -- | $380,000 +195.2% |
| 2007 | -- | $128,711 +2% |
| 2006 | -- | $126,188 +2% |
| 2005 | -- | $123,714 +2% |
| 2004 | -- | $121,290 +1.9% |
| 2003 | -- | $119,067 +2% |
| 2002 | -- | $116,733 +2% |
| 2001 | $1,866 | $114,444 |
Find assessor info on the county website
Monthly payment
Estimated monthly payment$1,822
All calculations are estimates and provided by Zillow, Inc. for informational purposes only. Actual amounts may vary.
HOA fees may include property taxes on listings classified as Co-Ops. Contact the listing agent and/or owner for fee details.
Mortgage interest rates are dependent on a number of factors, including credit score, down payment, and repayment length. Interest rate data provided by Zillow Group Marketplace, Inc. as of 1/1/1970 from various mortgage lenders with which we have lead or other similar arrangements; the Estimated Payment is an average of those rates.
See how much you could borrow to make a competitive offer.
Climate risks
Neighborhood: Cox
Nearby schools
GreatSchools rating
- 3/10Reach Academy ElementaryGrades: K-5Distance: 0.5 mi
- 3/10Elmhurst United MiddleGrades: 6-8Distance: 0.4 mi
- 2/10Castlemont HighGrades: 9-12Distance: 0.8 mi


- California
- Alameda County
- Oakland
- 94603
- Cox
- 9228 Walnut St
Nearby cities
Nearby neighborhoods
Nearby zip codes
Other Oakland Topics
