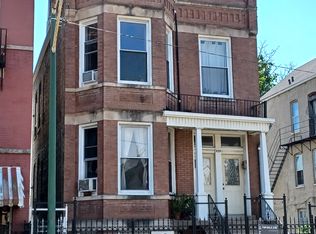
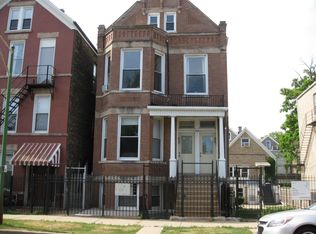
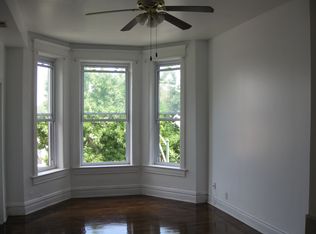
Fantastic investment opportunity in the highly desirable Bridgeport neighborhood! This well-maintained, all-brick legal 3-unit building offers excellent income potential and long-term value. Each spacious unit features a functional layout, abundant natural light, high ceilings, and separate utilities. The finished attic provides excellent potential to be used as additional family or recreation space. Ideally situated in one of Chicago's strongest rental markets, this property is just minutes from Chinatown, IIT, UIC, downtown Chicago, and major expressways including I-55 and I-90/94. Enjoy convenient access to restaurants, shopping, parks, public transportation, and the many new residential and mixed-use developments transforming the surrounding area. This is a rare chance to own a solid multifamily property in one of Chicago's fastest-growing neighborhoods. Schedule your private showing today!
Active
$759,000
939 W 32nd St, Chicago, IL 60608
4beds
--sqft
Multi Family
Built in ----
-- sqft lot
$733,500 Zestimate®
$--/sqft
$-- HOA
What's special
Finished atticHigh ceilingsAbundant natural lightFunctional layoutSpacious unit
- 38 days
- 267
- 22
Zillow last checked:
Listing updated:
Listed by:
Sharon Wong 312-428-9123,
Century 21 Realty Associates,
Shiming Zhong,
Century 21 Realty Associates
Source: MRED as distributed by MLS GRID,MLS#: 12785165
Facts & features
Interior
Bedrooms & bathrooms
- Bedrooms: 4
- Bathrooms: 3
- Full bathrooms: 3
Heating
- Has Heating (Unspecified Type)
Features
- Basement: Finished,Full
Property
Lot
- Size: 0.25 Acres
Details
- Parcel number: 17322120090000
- Special conditions: None
Construction
Type & style
- Home type: MultiFamily
- Property subtype: Multi Family
Materials
- Brick
Condition
- New construction: No
Utilities & green energy
- Sewer: Public Sewer
- Water: Public
Community & HOA
Location
- Region: Chicago
Financial & listing details
- Tax assessed value: $450,000
- Annual tax amount: $9,040
- Date on market: 10/14/2026
- Ownership: Fee Simple
Estimated market value
$733,500
$697,000 - $770,000
$2,717/mo
Price history
| Date | Event | Price |
|---|---|---|
| 10/14/2026 | Listed for sale | $759,000 |
Source:  MRED as distributed by MLS GRID #12785165 Report a problem | ||
| 10/1/2026 | Listing removed | $759,000 |
Source: MRED as distributed by MLS GRID #12677155 Report a problem | ||
| 8/4/2026 | Price change | $759,000-5% |
Source: MRED as distributed by MLS GRID #12677155 Report a problem | ||
| 6/19/2026 | Listed for sale | $799,000 |
Source: MRED as distributed by MLS GRID #12677155 Report a problem | ||
| 9/6/2022 | Listing removed | -- |
Source: Zillow Rental Manager Report a problem | ||
| 7/3/2022 | Price change | $980-2% |
Source: Zillow Rental Manager Report a problem | ||
| 6/19/2022 | Listed for rent | $1,000-9.1% |
Source: Zillow Rental Manager Report a problem | ||
| 6/6/2022 | Listing removed | -- |
Source: Zillow Rental Manager Report a problem | ||
| 6/3/2022 | Listed for rent | $1,100 |
Source: Zillow Rental Manager Report a problem | ||
Public tax history
| Year | Property taxes | Tax assessment |
|---|---|---|
| 2024 | $9,041 +71.4% | $45,000 +80% |
| 2023 | $5,275 +2.6% | $25,000 |
| 2022 | $5,142 +2.3% | $25,000 |
| 2021 | $5,027 -8.2% | $25,000 +1.7% |
| 2020 | $5,477 -3.5% | $24,587 -13% |
| 2019 | $5,678 +1.7% | $28,261 |
| 2018 | $5,583 -5.1% | $28,261 +3.4% |
| 2017 | $5,883 +7.5% | $27,328 |
| 2016 | $5,474 +9.3% | $27,328 |
| 2015 | $5,008 +10.3% | $27,328 +11.7% |
| 2014 | $4,539 +2% | $24,464 |
| 2013 | $4,449 +1.4% | $24,464 |
| 2012 | $4,390 -0.8% | $24,464 -10.4% |
| 2011 | $4,424 -0.4% | $27,301 |
| 2010 | $4,442 +4.4% | $27,301 |
| 2009 | $4,257 -3.4% | $27,301 -11.1% |
| 2008 | $4,406 +1% | $30,715 |
| 2007 | $4,362 -1.1% | $30,715 |
| 2006 | $4,409 +39.8% | $30,715 +59.1% |
| 2005 | $3,154 +1% | $19,302 |
| 2004 | $3,122 +72.5% | $19,302 |
| 2003 | $1,810 -5.4% | $19,302 +54.8% |
| 2002 | $1,913 +5.8% | $12,471 |
| 2001 | $1,809 +25.6% | $12,471 |
| 2000 | $1,440 +0.2% | $12,471 +31.3% |
| 1999 | $1,438 | $9,497 |
Find assessor info on the county website
Monthly payment
Est. payment
Payment breakdown
Explore the cost of this home by adjusting the details. Changes won't be saved.Climate risks
Neighborhood: Bridgeport
Nearby schools

Similar homes
- $759,9004 bd2 ba-- sqft2012 W 21st Pl, Chicago, IL 60608Active
 MLS ID #12783131, Adolfo Munoz, Realty of America, LLC. MRED as distributed by MLS GRID
- $518,2007 bd3 ba-- sqft3353 S Aberdeen St, Chicago, IL 60608Active
 MLS ID #12804325, Michael Ng, Mango Realty Group. MRED as distributed by MLS GRID
- $699,0005 bd4 ba-- sqft3041 S Lowe Ave, Chicago, IL 60616Active
 MLS ID #12752412, Jim Zhen, GoldHome Realty LLC. MRED as distributed by MLS GRID
- $779,9005 bd2 ba-- sqft1811 W Grand Ave, Chicago, IL 60622Active
 MLS ID #12783654, Eleftheria Latka, Delta Realty, Corp.. MRED as distributed by MLS GRID
