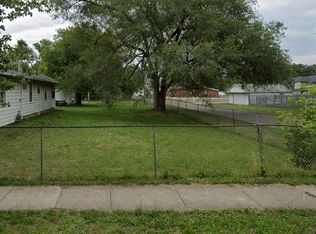
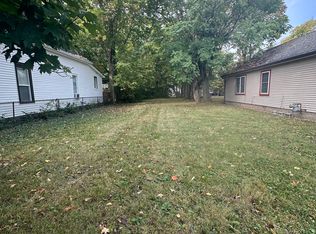
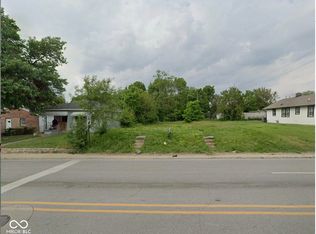
Great opportunity to build your own home! All due diligence (including survey, utility connection information, building codes, etc.) are the sole responsibility of the buyer.
Active
$29,000
944 Lynn St, Indianapolis, IN 46222
--beds
--baths
4,791Square Feet
Unimproved Land, Residential Lots
Built in ----
4,791 Square Feet Lot
$-- Zestimate®
$--/sqft
$-- HOA
What's special
- 216 days |
- 25 |
- 0 |
Zillow last checked:
Listing updated:
Listed by:
Nicole Crouch 317-514-7959,
Crossroads Realty, LLC,
Matthew Crouch
Source: MIBOR as distributed by MLS GRID,MLS#: 22074724
Facts & features
Property
Lot
- Size: 4,791 Square Feet
Details
- Parcel number: 491103137037000101
- Zoning: d5
- Zoning description: Single Family
- Horse amenities: None
Utilities & green energy
- Water: Not Applic
Community & HOA
Community
- Subdivision: Jefferson Park
Location
- Region: Indianapolis
Financial & listing details
- Tax assessed value: $3,300
- Annual tax amount: $78
- Date on market: 11/24/2025
- Cumulative days on market: 217 days
Estimated market value
Not available
Estimated sales range
Not available
Not available
Price history
| Date | Event | Price |
|---|---|---|
| 11/24/2025 | Listed for sale | $29,000-27.5% |
Source: | ||
| 1/31/2025 | Listing removed | $40,000 |
Source: | ||
| 5/16/2024 | Listed for sale | $40,000+5008.6% |
Source: | ||
| 4/26/2016 | Sold | $783 |
Source: Public Record Report a problem | ||
Public tax history
| Year | Property taxes | Tax assessment |
|---|---|---|
| 2025 | $78 -14.4% | $3,300 |
| 2024 | $92 -0.2% | $3,300 |
| 2023 | $92 -6.3% | $3,300 |
| 2022 | $98 +0.2% | $3,300 |
| 2021 | $98 -1.7% | $3,300 |
| 2020 | $99 -3% | $3,300 |
| 2019 | $103 +12.8% | $3,300 |
| 2018 | $91 | $3,300 |
| 2017 | -- | $3,300 |
| 2016 | $100 +3.6% | $3,300 |
| 2014 | $96 +30.2% | $3,300 |
| 2013 | $74 | $3,300 |
| 2012 | $74 | $3,300 -31.3% |
| 2011 | -- | $4,800 |
| 2010 | $102 -2.1% | $4,800 |
| 2009 | $104 | $4,800 -2% |
| 2007 | -- | $4,900 |
Find assessor info on the county website
Monthly payment
Estimated monthly payment$1,822
All calculations are estimates and provided by Zillow, Inc. for informational purposes only. Actual amounts may vary.
HOA fees may include property taxes on listings classified as Co-Ops. Contact the listing agent and/or owner for fee details.
Mortgage interest rates are dependent on a number of factors, including credit score, down payment, and repayment length. Interest rate data provided by Zillow Group Marketplace, Inc. as of 1/1/1970 from various mortgage lenders with which we have lead or other similar arrangements; the Estimated Payment is an average of those rates.
See how much you could borrow to make a competitive offer.
Climate risks
Neighborhood: Near Westside
Getting around
40 / 100
Some TransitNearby schools
GreatSchools rating
- 6/10George Washington Carver School 87Grades: PK-5Distance: 2.1 mi
- NAGeorge Washington Community High School (7-8)Grades: 7-8Distance: 1.1 mi
- 1/10George Washington Community High School (9-12)Grades: 9-12Distance: 1 mi
A local agent can set up tours, give advice and negotiate with sellers.

Nearby cities
Nearby neighborhoods
Nearby zip codes
Other Indianapolis Topics
