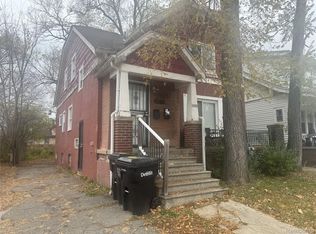
Brick 2-Family property looking for a new owner. Tenant occupied in both units, Tenants have been there 8 years and willing to stay. Tenants are related to each other. The lower unit bathroom needs some drywall ceiling repair, which can be negotiated or repaired prior to closing.
Pending
$69,900
9543 Cheyenne St, Detroit, MI 48227
4beds
1,975sqft
Multi Family
Built in 1928
-- sqft lot
$-- Zestimate®
$35/sqft
$-- HOA
What's special
- 167 days |
- 1 |
- 0 |
Zillow last checked:
Listing updated:
Listed by:
Kenneth Hunter 313-565-0000,
The Signature Group Realty, LLC 313-565-0000
Source: Realcomp II,MLS#: 20251040728
Facts & features
Interior
Bedrooms & bathrooms
- Bedrooms: 4
- Bathrooms: 2
- Full bathrooms: 2
Heating
- Forced Air, Natural Gas
Features
- Basement: Full,Unfinished
- Has fireplace: No
Interior area
- Total interior livable area: 1,975 sqft
- Finished area above ground: 1,975
Property
Parking
- Total spaces: 2
- Parking features: Shared Driveway
Features
- Levels: Two
- Stories: 2
- Pool features: None
Lot
- Size: 5,227 Square Feet
- Dimensions: 40.00 x 125.00
Details
- Parcel number: W22I026361S
- Zoning description: MultiFamily
- Special conditions: Agent Owned,Short Sale No
Construction
Type & style
- Home type: MultiFamily
- Architectural style: Colonial
- Property subtype: Multi Family
Materials
- Brick
- Foundation: Basement, Block
Condition
- New construction: No
- Year built: 1928
Utilities & green energy
- Sewer: Public Sewer
- Water: Public
Community & HOA
Community
- Subdivision: BUCKINGHAM PARK (PLATS)
Location
- Region: Detroit
Financial & listing details
- Price per square foot: $35/sqft
- Tax assessed value: $5,582
- Annual tax amount: $820
- Date on market: 9/29/2025
- Cumulative days on market: 167 days
- Listing agreement: Exclusive Right To Sell
- Listing terms: Cash,Conventional
Estimated market value
Not available
Estimated sales range
Not available
$1,029/mo
Price history
| Date | Event | Price |
|---|---|---|
| 12/3/2025 | Pending sale | $69,900$35/sqft |
Source: | ||
| 12/1/2025 | Price change | $69,900-7.9%$35/sqft |
Source: | ||
| 11/25/2025 | Price change | $75,900-5%$38/sqft |
Source: | ||
| 11/21/2025 | Listed for sale | $79,900$40/sqft |
Source: | ||
| 11/8/2025 | Pending sale | $79,900$40/sqft |
Source: | ||
| 11/3/2025 | Price change | $79,900-5.9%$40/sqft |
Source: | ||
| 10/27/2025 | Price change | $84,900-5.6%$43/sqft |
Source: | ||
| 10/13/2025 | Price change | $89,900-6.3%$46/sqft |
Source: | ||
| 9/29/2025 | Listed for sale | $95,900+142.2%$49/sqft |
Source: | ||
| 3/18/2008 | Sold | $39,600-58.3%$20/sqft |
Source: Public Record Report a problem | ||
| 6/13/2006 | Sold | $95,000+14.5%$48/sqft |
Source: Public Record Report a problem | ||
| 1/12/2004 | Sold | $83,000$42/sqft |
Source: Public Record Report a problem | ||
Public tax history
| Year | Property taxes | Tax assessment |
|---|---|---|
| 2025 | -- | $32,000 +24.5% |
| 2024 | -- | $25,700 +32.5% |
| 2023 | -- | $19,400 +19.8% |
| 2022 | -- | $16,200 +13.3% |
| 2021 | -- | $14,300 |
| 2020 | $1,129 +52.4% | $14,300 +22.2% |
| 2019 | $741 | $11,700 +8.3% |
| 2018 | $741 | $10,800 +1.9% |
| 2017 | -- | $10,600 +100% |
| 2016 | $988 | $5,300 |
| 2015 | $988 +49.3% | $5,300 -19.9% |
| 2013 | $662 -33% | $6,616 -30.2% |
| 2010 | $988 | $9,479 -12% |
| 2009 | -- | $10,772 -13.5% |
| 2008 | -- | $12,453 |
| 2007 | -- | $12,453 +5.5% |
| 2005 | $143 | $11,804 +3% |
| 2004 | -- | $11,460 |
Find assessor info on the county website
Monthly payment
Est. payment$--/mo
Payment breakdown
Explore the cost of this home by adjusting the details. Changes won't be saved.All calculations are estimates and provided by Zillow, Inc. for informational purposes only. Actual amounts may vary.
HOA fees may include property taxes on listings classified as Co-Ops. Contact the listing agent and/or owner for fee details.
Mortgage interest rates are dependent on a number of factors, including credit score, down payment, and repayment length. Interest rate data provided by Zillow Group Marketplace, Inc. as of 1/1/1970 from various mortgage lenders with which we have lead or other similar arrangements; the Estimated Payment is an average of those rates.
See how much you could borrow to make a competitive offer.
Climate risks
Neighborhood: Barton-McFarland
Getting around
42 / 100
Some TransitNearby schools
GreatSchools rating
- 3/10Mackenzie Elementary-Middle SchoolGrades: PK-8Distance: 0.7 mi
- 3/10Cody High SchoolGrades: 9-12Distance: 2.4 mi
A local agent can set up tours, give advice and negotiate with sellers.


- Michigan
- Wayne County
- Detroit
- 48227
- Barton-McFarland
- 9543 Cheyenne St
Nearby cities
Nearby neighborhoods
Nearby zip codes
Other Detroit Topics
