Come with your highest and best offer. It has great potential but will need repairs/updating to be at its best. Each of the 2 units has its own electric and water meter. LOCATION!!! VACANT
Foreclosure
Est. $574,999
9751 NW 5th Ct, Miami, FL 33150
5beds
3baths
1,998sqft
Duplex
Built in 1969
-- sqft lot
$-- Zestimate®
$288/sqft
$-- HOA
Overview
- 12 days
- 118
- 13
Zillow last checked:
Listing updated:
Listed by:
Marina Osmacova 786-440-3066,
MIAMI VIP REALTY LLC
Source: MIAMI,MLS#: A12118853 Originating MLS: A-Miami Association of REALTORS
Facts & features
Interior
Bedrooms & bathrooms
- Bedrooms: 5
- Bathrooms: 3
Heating
- Other
Cooling
- Other
Features
- Flooring: Other
Interior area
- Total structure area: 2,206
- Total interior livable area: 1,998 sqft
Video & virtual tour
Property
Parking
- Total spaces: 2
Features
- Stories: 1
Lot
- Features: Less Than 1/4 Acre Lot
Details
- Parcel number: 3031010070180
- Zoning: 5100
Construction
Type & style
- Home type: MultiFamily
- Architectural style: Other
- Property subtype: Duplex
Materials
- CBS Construction
- Roof: Composition Roll,Shingle
Condition
- Year built: 1969
Utilities & green energy
- Sewer: Public Sewer
Community & HOA
Community
- Subdivision: 1st Addn To Pinewood Park
HOA
- Has HOA: No
Location
- Region: Miami
Financial & listing details
- Price per square foot: $288/sqft
- Tax assessed value: $465,360
- Annual tax amount: $8,611
- Date on market: 11/5/2026
- Listing terms: All Cash,Conventional
Foreclosure details
Estimated market value
Not available
Estimated sales range
Not available
$3,481/mo
Price history
| Date | Event | Price |
|---|---|---|
| 11/9/2026 | Listed for sale | $574,999+39.5%$288/sqft |
Source:  MIAMI #A12118853 Report a problem | ||
| 8/19/2026 | Sold | $412,100-35.1%$206/sqft |
Source: Public Record Report a problem | ||
| 4/21/2025 | Price change | $635,000-9.3%$318/sqft |
Source:  BeachesMLS #F10486209 Report a problem | ||
| 4/19/2025 | Listed for sale | $700,000$350/sqft |
Source: BeachesMLS #F10486209 Report a problem | ||
| 3/31/2025 | Pending sale | $700,000$350/sqft |
Source: BeachesMLS #F10486209 Report a problem | ||
| 2/11/2025 | Listed for sale | $700,000+117.1%$350/sqft |
Source: BeachesMLS #F10486209 Report a problem | ||
| 10/30/2018 | Sold | $322,500+218%$161/sqft |
Source: Public Record Report a problem | ||
| 10/20/2017 | Sold | $101,400+102.8%$51/sqft |
Source: Public Record Report a problem | ||
| 8/30/1994 | Sold | $50,000$25/sqft |
Source: Public Record Report a problem | ||
Public tax history
| Year | Property taxes | Tax assessment |
|---|---|---|
| 2025 | $8,611 +1.2% | $398,031 +10% |
| 2024 | $8,507 +20.2% | $361,847 +10% |
| 2023 | $7,079 +9.4% | $328,952 +10% |
| 2022 | $6,468 +11.9% | $299,048 +10% |
| 2021 | $5,781 +3.9% | $271,862 +6.7% |
| 2020 | $5,562 +8.8% | $254,692 +10% |
| 2019 | $5,111 +11.5% | $231,539 +10% |
| 2018 | $4,584 | $210,490 +29.3% |
| 2017 | $4,584 +17.5% | $162,796 +10% |
| 2016 | $3,902 +10.5% | $147,997 +8.9% |
| 2015 | $3,532 +10.2% | $135,855 +10% |
| 2014 | $3,206 -12.1% | $123,505 +1.5% |
| 2013 | $3,649 | $121,689 -18.1% |
| 2012 | $3,649 -1.4% | $148,501 -0.5% |
| 2011 | $3,701 -15.6% | $149,283 -12.3% |
| 2010 | $4,383 -15.9% | $170,249 -25.5% |
| 2009 | $5,213 -14% | $228,458 -17.8% |
| 2007 | $6,061 +49% | $277,867 |
| 2006 | $4,068 | -- |
| 2005 | $4,068 +15.2% | -- |
| 2004 | $3,530 +26% | -- |
| 2003 | $2,801 +9.1% | -- |
| 2002 | $2,568 | -- |
| 2001 | $2,568 | -- |
Find assessor info on the county website
Monthly payment
Climate risks
Neighborhood: 33150
Similar homes
- $575,0005 bd2 ba1.5k sqftLa Paloma, Miami, FL 33161For Sale
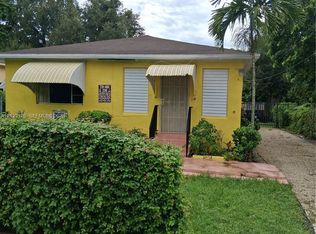
 MLS ID #A12122126, Heribert Jean-Louis, Housepower Realty Group. MIAMI
- $583,0005 bd3 ba1.6k sqftGordon Dale Pk, Miami, FL 33150For Sale
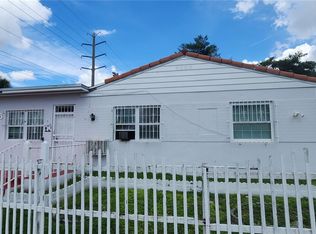 MLS ID #A11885364, Jose Marrero, Coldwell Banker Realty. MIAMI
- $540,0003 bd2 ba1.4k sqftParkers Shores, Miami, FL 33150For Sale
 MLS ID #A11944660, Jose Amasifuen, Epic Choice Realty. MIAMI
- $549,0005 bd2 ba1.5k sqftFloral Park 1st Amd Pl, Miami, FL 33142For Sale
 MLS ID #A12117728, Adrian Ambros, Florida Realty of Miami Corp. MIAMI
- $595,9006 bd3 ba1.7k sqft17th Ave Manor 2nd Addn, Miami, FL 33142For SaleMLS ID #A12119971, Idalia Nunez, London Foster Realty. MIAMI
- $555,0004 bd2 ba1.4k sqftStephen Manor, Miami, FL 33150For SaleMLS ID #A11996211, Santiago Silva, The Pampas Real Estate Group, LLC.. MIAMI
- $550,0004 bd11 ba1.5k sqftMiami Highlands Sec A, Miami, FL 33161For SaleMLS ID #A12108660, Seyon Dunbar, EXP Realty LLC. MIAMI
- $575,0004 bd2 ba1.4k sqftLittle River Trs, Miami, FL 33167For SaleMLS ID #A12084345, Joanne Jones, Compass Florida, LLC. MIAMI
- $499,9003 bd2 ba1.3k sqft7th Avenue Highlands, Miami, FL 33150For SaleMLS ID #A12071785, Ronald Henry, Premier Realty & Invest. Group. MIAMI
- $495,0003 bd1 ba1.4k sqftSeventh Ave Park, Miami, FL 33150For SaleMLS ID #A12118883, Yeanli Velez, LPT Realty, LLC. MIAMI
- $569,9994 bd2 ba1.6k sqftOcean Park, Hallandale Beach, FL 33009For SaleMLS ID #A12117876, Snidwing Black, Coldwell Banker Realty. MIAMI
- $599,0004 bd2 ba1.8k sqftHialeah 14 Addn, Hialeah, FL 33013For SaleMLS ID #A12089922, Peter Garcia, Iconic Luxury Real Estate Corp. MIAMI
- $698,5004 bd3 ba1.7k sqftPasadena Park Sub, Miami, FL 33161For SaleMLS ID #A12069814, Carolina Hernandez, Ancla Realty, Inc.. MIAMI
- $625,0004 bd3 ba1.4k sqftWest End Park Amd Pl, Miami, FL 33142For SaleMLS ID #A12025161, Cuindney Mantilla, Miami Residential Group. MIAMI
- $480,0004 bd2 ba1.3k sqftRainbow Gardens, Opa Locka, FL 33054For SaleMLS ID #A12119907, Barclay Belizaire, Keller Williams Eagle Realty. MIAMI
- $575,9004 bd2 ba1.6k sqftRo-Len Acres, Hallandale, FL 33009For SaleMLS ID #A12074397, James Augustin, AJK Luxury Realty LLC. MIAMI
- $443,5004 bd2 ba1.2k sqft1st Addn To Golden Highlan, Miami Gardens, FL 33054For SaleMLS ID #A12124162, Steven Koleno, Beycome of Florida LLC. MIAMI
- $599,5004 bd2 ba1.5k sqftHallandale Garden Park, Hallandale, FL 33009For SaleMLS ID #A12093143, Roberto Sosa Gonzalez, Miami Beach Real Estate Group. MIAMI
- $599,0006 bd3 ba1.6k sqft4th Avenue Extension To H, Hialeah, FL 33013For SaleMLS ID #A11985991, Deborah Pinero, Majestic Realty Services. MIAMI
- $700,0006 bd4 ba2.3k sqftOrchard Villa Extension, Miami, FL 33142For SaleMLS ID #A12071457, Oswaldo Sanchez Robleno, Miami New Realty. MIAMI
