Beautiful home featuring 3 spacious bedrooms, 2 bathrooms, and a versatile den perfect for a home office or additional living space. Enjoy a private pool ideal for relaxing, entertaining, and enjoying the Florida lifestyle. This home offers a wonderful combination of comfort, functionality, and outdoor enjoyment, making it the perfect place to call home.
New construction
Price cut: $11K (11/9)
$449,000
CAPE CORAL, FL 33991
3beds
1,900sqft
Single Family Residence
Built in 2026
10,018 Square Feet Lot
$-- Zestimate®
$236/sqft
$-- HOA
What's special
- 36 days
- 102
- 18
Zillow last checked:
Listing updated:
Listed by:
Jessica Padron 786-853-1099,
Xclusive Homes LLC
Source: SWFLMLS,MLS#: 226037021 Originating MLS: Naples
Facts & features
Interior
Bedrooms & bathrooms
- Bedrooms: 3
- Bathrooms: 2
- Full bathrooms: 2
Rooms
- Room types: Den - Study, 3 Bedrooms Plus Den
Dining room
- Features: Other
Heating
- Central
Cooling
- Central Air
Appliances
- Included: Other
Features
- Other, Den - Study
- Windows: Impact Resistant Windows
- Has fireplace: No
Interior area
- Total structure area: 2,600
- Total interior livable area: 1,900 sqft
Property
Parking
- Total spaces: 3
- Parking features: Attached, Attached Carport
- Attached garage spaces: 1
- Carport spaces: 2
- Covered spaces: 3
Features
- Stories: 1
- Has private pool: Yes
- Pool features: In Ground
- Has view: Yes
- Waterfront features: None
Lot
- Size: 10,018 Square Feet
Details
- Parcel number: 164423C103710.0120
- Zoning: R1-D
Construction
Type & style
- Home type: SingleFamily
- Property subtype: Single Family Residence
Materials
- Block, Stucco
- Foundation: Concrete Block
- Roof: Shingle
Condition
- New construction: Yes
- Year built: 2026
Utilities & green energy
- Sewer: Septic Tank
- Water: Well
Community & HOA
Community
- Features: Non-Gated
- Subdivision: CAPE CORAL
HOA
- Has HOA: No
Location
- Region: Cape Coral
Financial & listing details
- Price per square foot: $236/sqft
- Annual tax amount: $926
- Date on market: 10/12/2026
- Lease term: FHA
Estimated market value
Not available
Estimated sales range
Not available
Not available
Price history
| Date | Event | Price |
|---|---|---|
| 11/9/2026 | Price change | $449,000-2.4%$236/sqft |
Source:  SWFLMLS #226037021 Report a problem | ||
| 10/13/2026 | Pending sale | $460,000$242/sqft |
Source: SWFLMLS #226037021 Report a problem | ||
| 10/12/2026 | Listed for sale | $460,000+1143.2%$242/sqft |
Source: SWFLMLS #226037021 Report a problem | ||
| 5/27/2025 | Sold | $37,000$19/sqft |
Source: Public Record Report a problem | ||
Public tax history
| Year | Property taxes | Tax assessment |
|---|---|---|
| 2025 | $926 +10.3% | $13,120 +10% |
| 2024 | $840 +3.6% | $11,927 +10% |
| 2023 | $811 +29.1% | $10,843 +10% |
| 2022 | $628 +13.8% | $9,857 +10% |
| 2021 | $552 +8.5% | $8,961 +10% |
| 2020 | $509 +1.7% | $8,146 -52.1% |
| 2019 | $500 | $17,000 -17.1% |
| 2018 | $500 -2.9% | $20,500 +89.4% |
| 2017 | $515 +22.2% | $10,821 +35.3% |
| 2016 | $421 +12% | $8,000 +17.6% |
| 2015 | $376 +10.8% | $6,800 +14.8% |
| 2014 | $339 +22.6% | $5,922 +31.6% |
| 2013 | $277 +46.9% | $4,500 +18.4% |
| 2012 | $189 +1% | $3,800 -7.3% |
| 2011 | $187 -27.4% | $4,100 -39.7% |
| 2010 | $257 -2.6% | $6,800 -9.3% |
| 2009 | $264 -18.7% | $7,500 -50% |
| 2008 | $325 -61.7% | $15,000 -66.7% |
| 2007 | $848 -44.9% | $45,000 -45.1% |
| 2006 | $1,539 +371.4% | $82,000 +511.9% |
| 2004 | $327 +109.7% | $13,400 +147.7% |
| 2003 | $156 +52.5% | $5,410 +76.8% |
| 2002 | $102 | $3,060 +50% |
| 2000 | -- | $2,040 |
Monthly payment
Est. payment
Payment breakdown
Explore the cost of this home by adjusting the details. Changes won't be saved.Climate risks
Neighborhood: 33991

Similar homes
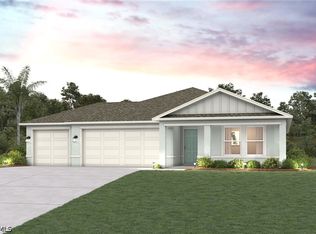
- $419,8004 bd2 ba1.8k sqft114 SW 16th Pl, Cape Coral, FL 33991For Sale
 MLS ID #2026047920, Ayelet Marcus, Trust Realty USA, LLC. Florida Gulf Coast MLS
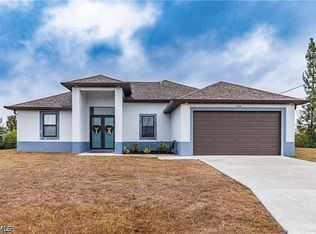
- $419,0003 bd2 ba1.8k sqft4520 SW 22nd AVE, CAPE CORAL, FL 33914For Sale
 MLS ID #226038973, Dodona Roboci, PA, Royal Shell Real Estate, Inc.. SWFLMLS
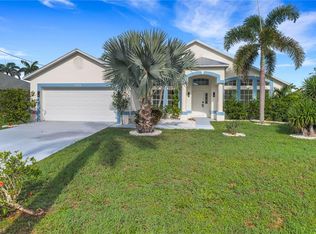
- $439,9003 bd2 ba1.6k sqft2511 NW 7th ST, CAPE CORAL, FL 33993New Construction
 MLS ID #226017580, Eduardo Arriagada, Century 21 Tenace Realty. SWFLMLS
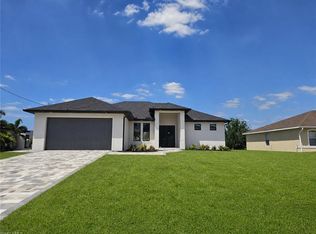
- $419,0003 bd2 ba1.7k sqft2310 NW 7th Ave, Cape Coral, FL 33993New Construction
 MLS ID #2026044259, FERNANDO Gaitan, Legacy Premier Realty LLC. Florida Gulf Coast MLS
- $439,0004 bd3 ba1.9k sqft2204 NW 5th Ter, Cape Coral, FL 33993New ConstructionMLS ID #2026029171, Maria Suri, United Realty Group Inc. Florida Gulf Coast MLS
- $425,0003 bd2 ba1.7k sqft2700 NW 6th St, Cape Coral, FL 33993New ConstructionMLS ID #2026012343, Kehila Mendoza Duran, Ace Realty & Associates, LLC. Florida Gulf Coast MLS
- $430,0004 bd3 ba1.9k sqft2903 NW 6th Ter, Cape Coral, FL 33993New ConstructionMLS ID #2026025631, Maria Suri, United Realty Group Inc. Florida Gulf Coast MLS
- $360,0003 bd2 ba1.4k sqft211 NW 25th Ave, Cape Coral, FL 33993For SaleMLS ID #2026036270, Stephen Hachey, Flat Fee MLS Realty. Florida Gulf Coast MLS
- $459,9004 bd3 ba1.6k sqft300 NW 18th St, Cape Coral, FL 33993New ConstructionMLS ID #2026044368, Alexander Gonzalez Barrios, Best Deals Realty LLC. Florida Gulf Coast MLS
- $438,0004 bd2 ba1.6k sqft1213 NW 22nd PL, CAPE CORAL, FL 33993New ConstructionMLS ID #225082849, Eduardo Arriagada, Century 21 Tenace Realty. SWFLMLS
- $459,0003 bd3 ba1.5k sqft1514 NE 7th Ave, Cape Coral, FL 33909New ConstructionMLS ID #2026045578, Hanzel Alpizar, Best Deals Realty LLC. Florida Gulf Coast MLS
- $450,0004 bd3 ba1.8k sqft1506 NE 21st Ave, Cape Coral, FL 33909For SaleMLS ID #2026044774, Rosy Palermo, Palermo Real Estate LLC. Florida Gulf Coast MLS
- $389,9003 bd2 ba1.3k sqft103 Diplomat PKWY E, CAPE CORAL, FL 33909New ConstructionMLS ID #226041599, Diosqui Cruz Padron, Invest Ready Realty. SWFLMLS
- $599,9903 bd2 ba1.5k sqft139 SW 10th Ave, Cape Coral, FL 33991For SaleMLS ID #2026041252, Greisy Valdes, Mamba Realty LLC. Florida Gulf Coast MLS
- $409,9004 bd3 ba1.8k sqft2500 NW 7th St, Cape Coral, FL 33993New ConstructionMLS ID #225034776, Roylan Valdivia, United Realty Group Inc. Florida Gulf Coast MLS
- $435,0004 bd3 ba1.9k sqft19 NW 25th ST, CAPE CORAL, FL 33993New ConstructionMLS ID #226033209, Erik Rocha, Xclusive Homes LLC. SWFLMLS
- $415,0003 bd2 ba1.8k sqft1239 NW 24th Ter, Cape Coral, FL 33993New ConstructionMLS ID #2026035460, Dan Farber, HelloSold LLC. Florida Gulf Coast MLS
- $499,9004 bd2 ba1.9k sqft2919 El Dorado BLVD N, CAPE CORAL, FL 33993For SaleMLS ID #226031492, Claire Gogan, EXP Realty LLC. SWFLMLS
- $515,0004 bd3 ba2k sqft427 SW 21st Ter, Cape Coral, FL 33991New ConstructionMLS ID #2026036476, Renzo Ordinola, Marzucco Real Estate. Florida Gulf Coast MLS
- $399,9773 bd2 ba1.7k sqft1032 NW 36th Pl, Cape Coral, FL 33993New ConstructionMLS ID #2026004884, A.D. Diaz, Century 21 Sunbelt Realty. Florida Gulf Coast MLS
