$6,500
2,904 Square Feet
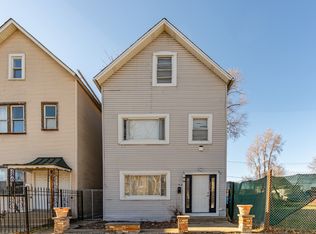
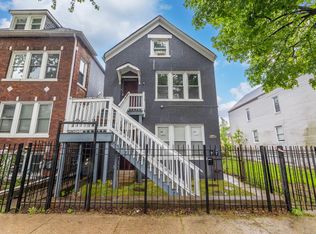
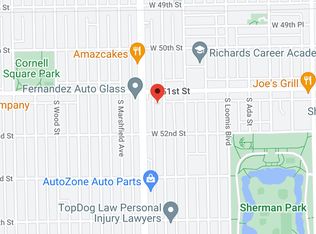
5118 S Justine St, Chicago, IL 60609
Lot/Land
Zillow last checked:
Javier Alday 708-788-1900,
Realty of America, LLC,
Lilianny Pereda 224-639-7679,
Realty of America, LLC
Not available
Estimated sales range
Not available
Not available
| Date | Event | Price |
|---|---|---|
| 6/9/2026 | Listing removed | $329,900 |
Source: MRED as distributed by MLS GRID #12634853 Report a problem | ||
| 4/30/2026 | Listed for sale | $329,900-1.5% |
Source: | ||
| 4/10/2026 | Contingent | $334,900 |
Source: | ||
| 3/10/2026 | Price change | $334,900-1.5% |
Source: | ||
| 1/9/2026 | Listed for sale | $339,900-11.7% |
Source: | ||
| 1/9/2026 | Listing removed | $385,000 |
Source: | ||
| 12/10/2025 | Listed for sale | $385,000+816.7% |
Source: | ||
| 3/28/2014 | Sold | $42,000+47.4% |
Source: | ||
| 2/19/2014 | Listed for sale | $28,500-62% |
Source: Great Street Properties, Inc. #08539201 Report a problem | ||
| 8/17/2004 | Sold | $75,000+837.5% |
Source: Public Record Report a problem | ||
| 4/9/1999 | Sold | $8,000-99.4% |
Source: Public Record Report a problem | ||
| 10/12/1995 | Sold | $1,350,000 |
Source: Public Record Report a problem | ||
| Year | Property taxes | Tax assessment |
|---|---|---|
| 2024 | -- | $10,000 +185.8% |
| 2023 | $742 +2.6% | $3,499 |
| 2022 | $724 +2.9% | $3,499 |
| 2021 | $704 -46.8% | $3,499 -40.7% |
| 2020 | $1,324 -3.5% | $5,903 -13% |
| 2019 | $1,372 +1.7% | $6,786 |
| 2018 | $1,349 -48.7% | $6,786 -44.1% |
| 2017 | $2,631 +7.5% | $12,140 |
| 2016 | $2,448 +9.2% | $12,140 |
| 2015 | $2,241 +12.6% | $12,140 +14.1% |
| 2014 | $1,990 +2% | $10,644 |
| 2013 | $1,951 +1.3% | $10,644 |
| 2012 | $1,926 -18.3% | $10,644 -26.4% |
| 2011 | $2,358 -0.5% | $14,455 |
| 2010 | $2,369 +4.3% | $14,455 |
| 2009 | $2,272 -0.5% | $14,455 -8.5% |
| 2008 | $2,283 +0.9% | $15,796 |
| 2007 | $2,262 -17% | $15,796 -16.1% |
| 2006 | $2,724 +147.9% | $18,819 +179.9% |
| 2005 | $1,099 +0.1% | $6,724 |
| 2004 | $1,098 +2.2% | $6,724 |
| 2003 | $1,074 +5.5% | $6,724 +19.8% |
| 2002 | $1,018 +3.7% | $5,611 |
| 2001 | $982 +77.7% | $5,611 |
| 2000 | $553 | $5,611 +97.1% |
| 1999 | -- | $2,847 |
Source: MRED as distributed by MLS GRID. This data may not be complete. We recommend contacting the local school district to confirm school assignments for this home.
A local agent can set up tours, give advice and negotiate with sellers.
A local lender can help you make sure your offer is ready when you are.