$73,400
1 bd|-- ba|-- sqft
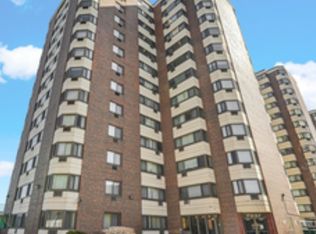
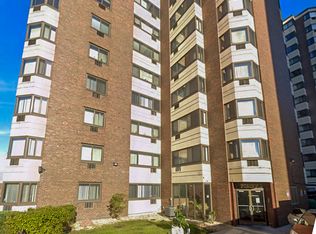
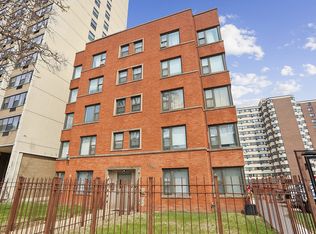
7337 S South Shore Dr APT 101, Chicago, IL 60649
Off Market
Zillow last checked:
Justin Penn 312-216-2422,
Keller Williams ONEChicago
Not available
Estimated sales range
Not available
$1,443/mo
| Date | Event | Price |
|---|---|---|
| 6/20/2025 | Listing removed | $49,900$62/sqft |
Source: | ||
| 3/24/2025 | Contingent | $49,900$62/sqft |
Source: | ||
| 1/19/2025 | Listed for sale | $49,900+131%$62/sqft |
Source: | ||
| 4/29/2016 | Sold | $21,600$27/sqft |
Source: | ||
| 1/5/2016 | Pending sale | $21,600$27/sqft |
Source: Coldwell Banker Residential Brokerage - Orland Park #08881102 Report a problem | ||
| 6/12/2015 | Price change | $21,600+72.8%$27/sqft |
Source: Coldwell Banker Residential Brokerage - Orland Park #08881102 Report a problem | ||
| 6/1/2015 | Pending sale | $12,500$16/sqft |
Source: Coldwell Banker Residential Brokerage - Orland Park #08881102 Report a problem | ||
| 5/21/2015 | Price change | $12,500-46.8%$16/sqft |
Source: Coldwell Banker Residential Brokerage - Orland Park #08881102 Report a problem | ||
| 4/5/2015 | Listed for sale | $23,500-28.8%$29/sqft |
Source: Coldwell Banker Residential Brokerage - Orland Park #08881102 Report a problem | ||
| 6/17/1999 | Sold | $33,000$41/sqft |
Source: Public Record Report a problem | ||
| Year | Property taxes | Tax assessment |
|---|---|---|
| 2024 | -- | $5,397 +260% |
| 2023 | $317 +2.9% | $1,499 |
| 2022 | $308 +2.3% | $1,499 |
| 2021 | $301 -17.1% | $1,499 -8.1% |
| 2020 | $364 +0.2% | $1,632 -9.6% |
| 2019 | $363 +1.7% | $1,806 |
| 2018 | $357 +8% | $1,806 +17.7% |
| 2017 | $330 +7.5% | $1,535 |
| 2016 | $307 -9.8% | $1,535 -17.5% |
| 2015 | $341 -5.1% | $1,861 -3.9% |
| 2014 | $359 -16% | $1,936 -17.7% |
| 2013 | $428 +1.4% | $2,351 |
| 2012 | $422 -28.5% | $2,351 -35.4% |
| 2011 | $590 -0.4% | $3,641 |
| 2010 | $592 -16.5% | $3,641 -20% |
| 2009 | $710 +17.5% | $4,552 +8% |
| 2008 | $604 -11.6% | $4,213 -12.5% |
| 2007 | $684 -1.1% | $4,815 |
| 2006 | $691 +23.9% | $4,815 +41% |
| 2005 | $558 +1% | $3,415 |
| 2004 | $552 +2.2% | $3,415 |
| 2003 | $540 +1.4% | $3,415 +15.1% |
| 2002 | $533 +3.7% | $2,967 |
| 2001 | $514 +19.5% | $2,967 |
| 2000 | $430 -0.7% | $2,967 +32.6% |
| 1999 | $433 | $2,238 |
Source: MRED as distributed by MLS GRID. This data may not be complete. We recommend contacting the local school district to confirm school assignments for this home.
A local agent can set up tours, give advice and negotiate with sellers.