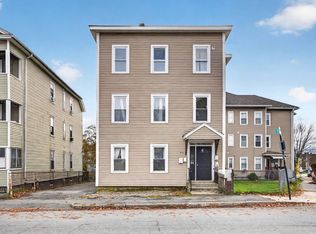
Great opportunity to own a well-maintained 3-family property! This property has been exceptionally cared for by the seller and is truly move-in ready. The roof is approximately 5 years old, and two of the three units have updated heating systems installed within the past 4 years. The property also offers off-street parking for up to 6 vehicles. With no major repairs needed, this is an excellent opportunity for an owner-occupant or investor looking for a solid multi-family property.
Pending
$719,900
1 Pitt St, Worcester, MA 01610
9beds
3,225sqft
3 Family
Built in 1890
-- sqft lot
$731,800 Zestimate®
$223/sqft
$-- HOA
What's special
Updated heating systems
- 45 days
- 52
- 2
Likely to sell faster than
Zillow last checked:
Listing updated:
Listed by:
Sinara Moreira 508-847-8886,
Dell Realty Inc. 617-629-5950,
Dell Costa 508-294-8566
Source: MLS PIN,MLS#: 73586604
Facts & features
Interior
Bedrooms & bathrooms
- Bedrooms: 9
- Bathrooms: 3
- Full bathrooms: 3
Features
- Flooring: Tile, Laminate
- Basement: Full
- Has fireplace: No
Interior area
- Total structure area: 3,225
- Total interior livable area: 3,225 sqft
- Finished area above ground: 3,225
Property
Parking
- Total spaces: 6
- Parking features: Paved Drive
- Uncovered spaces: 6
Lot
- Size: 4,812 Square Feet
Details
- Parcel number: 1769446
- Zoning: RES
Construction
Type & style
- Home type: MultiFamily
- Property subtype: 3 Family
Materials
- Frame
- Foundation: Stone
- Roof: Shingle
Condition
- Year built: 1890
Utilities & green energy
- Sewer: Public Sewer
- Water: Public
Community & HOA
Community
- Features: Public Transportation, Shopping, Tennis Court(s), Park, Walk/Jog Trails, Medical Facility, Laundromat, Highway Access, University
Location
- Region: Worcester
Financial & listing details
- Price per square foot: $223/sqft
- Tax assessed value: $665,600
- Annual tax amount: $8,839
- Date on market: 10/5/2026
- Total actual rent: 0
Estimated market value
$731,800
$666,000 - $790,000
$2,005/mo
Price history
| Date | Event | Price |
|---|---|---|
| 11/2/2026 | Pending sale | $719,900$223/sqft |
Source: MLS PIN #73586604 Report a problem | ||
| 10/19/2026 | Contingent | $719,900$223/sqft |
Source: MLS PIN #73586604 Report a problem | ||
| 10/5/2026 | Listed for sale | $719,900+283.9%$223/sqft |
Source: MLS PIN #73586604 Report a problem | ||
| 7/24/2006 | Sold | $187,500$58/sqft |
Source: Public Record Report a problem | ||
| 7/6/2001 | Sold | $187,500$58/sqft |
Source: Public Record Report a problem | ||
Public tax history
| Year | Property taxes | Tax assessment |
|---|---|---|
| 2025 | $8,544 +8.8% | $647,800 +13.4% |
| 2024 | $7,853 +4.2% | $571,100 +8.6% |
| 2023 | $7,539 +14.7% | $525,700 +21.6% |
| 2022 | $6,574 +14% | $432,200 +22.1% |
| 2021 | $5,765 +8.4% | $354,100 +13.2% |
| 2020 | $5,318 +17% | $312,800 +23.9% |
| 2019 | $4,545 +2.4% | $252,500 +7.6% |
| 2018 | $4,438 +6.7% | $234,700 +8.4% |
| 2017 | $4,161 +4.4% | $216,500 +11.9% |
| 2016 | $3,986 +2.7% | $193,400 |
| 2015 | $3,882 +2.7% | $193,400 |
| 2014 | $3,779 +4.4% | $193,400 -0.7% |
| 2013 | $3,618 +6.9% | $194,700 -2.4% |
| 2012 | $3,386 -20.6% | $199,400 -29.1% |
| 2010 | $4,263 -4.1% | $281,400 -14.5% |
| 2009 | $4,443 +10.1% | $329,100 +2.3% |
| 2008 | $4,035 -4.5% | $321,800 -7.8% |
| 2007 | $4,224 +2.3% | $349,100 +5.9% |
| 2006 | $4,131 -3.8% | $329,700 +1.2% |
| 2005 | $4,294 +29.8% | $325,800 +45.3% |
| 2004 | $3,308 +25.7% | $224,300 +37.8% |
| 2003 | $2,631 +8.2% | $162,800 +19.5% |
| 2002 | $2,431 +41.3% | $136,200 +46.1% |
| 2000 | $1,721 +24.5% | $93,200 +25.9% |
| 1997 | $1,382 | $74,000 |
Find assessor info on the county website
Monthly payment
Est. payment
Payment breakdown
Explore the cost of this home by adjusting the details. Changes won't be saved.Climate risks
Neighborhood: 01610


Similar homes
- $725,0009 bd3 ba4.4k sqft15 Sigel St, Worcester, MA 01610For Sale
 MLS ID #73572038, Rayna Shelton-Wynn, MIG. MLS PIN
- $660,0009 bd3 ba3.5k sqft404 Cambridge St, Worcester, MA 01610For Sale
 MLS ID #73600680, Candor Investment Group, eXp Realty LLC. MLS PIN
- $799,9009 bd3 ba3.6k sqft31 Suffield St, Worcester, MA 01610For Sale
 MLS ID #73586792, Carmen De La Cruz, Property Investors & Advisors, LLC. MLS PIN
- $--8 bd3 ba2.8k sqft141 Beacon St, Worcester, MA 01610Auction
 ServiceLink Auction
