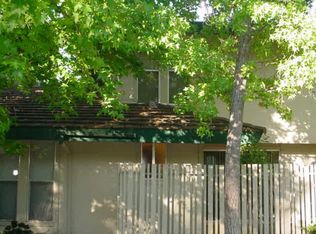
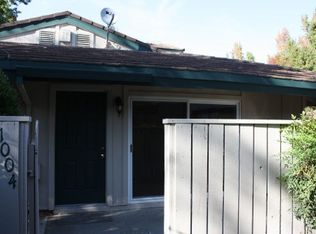
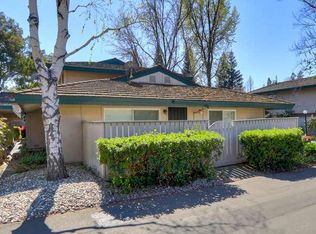
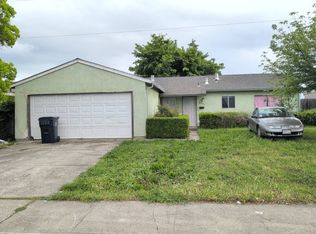
Good buy in a nice gated community with pool and clubhouse. Great 2 bed 1 bath floorplan. Lots of mature trees to shade your summer days.
Pre-foreclosure
Est. $270,500
1003 Roundtree Ct, Sacramento, CA 95831
2beds
1baths
1,074sqft
Condo
Built in 1972
-- sqft lot
$270,500 Zestimate®
$252/sqft
$-- HOA
Overview
- 75 days |
- 18 |
- 0 |
Facts & features
Interior
Bedrooms & bathrooms
- Bedrooms: 2
- Bathrooms: 1
Heating
- Other
Cooling
- Central
Interior area
- Total interior livable area: 1,074 sqft
Property
Parking
- Total spaces: 2
- Parking features: Garage - Attached
Lot
- Size: 871 Square Feet
Details
- Parcel number: 03004700220000
Construction
Type & style
- Home type: Condo
Materials
- wood frame
- Roof: Shake / Shingle
Condition
- Year built: 1972
Community & HOA
Location
- Region: Sacramento
Financial & listing details
- Price per square foot: $252/sqft
- Tax assessed value: $220,868
- Annual tax amount: $3,825
Visit our professional directory to find a foreclosure specialist in your area that can help with your home search.
Find a foreclosure agentForeclosure details
Estimated market value
$270,500
$252,000 - $287,000
$1,955/mo
Price history
| Date | Event | Price |
|---|---|---|
| 9/17/2018 | Sold | $198,000+187%$184/sqft |
Source: Public Record Report a problem | ||
| 4/5/2011 | Listing removed | $69,000$64/sqft |
Source: Capitol City Real Estate #10021521 Report a problem | ||
| 3/23/2011 | Listed for sale | $69,000+6.2%$64/sqft |
Source: Capitol City Real Estate #10021521 Report a problem | ||
| 8/20/2010 | Sold | $65,000-5.8%$61/sqft |
Source: MetroList Services of CA #10021521 Report a problem | ||
| 7/11/2010 | Price change | $69,000-8%$64/sqft |
Source: foreclosure.com Report a problem | ||
| 6/23/2010 | Price change | $75,000-6.3%$70/sqft |
Source: foreclosure.com Report a problem | ||
| 5/22/2010 | Price change | $80,000-5.9%$74/sqft |
Source: foreclosure.com Report a problem | ||
| 4/24/2010 | Price change | $85,000-6.1%$79/sqft |
Source: foreclosure.com Report a problem | ||
| 3/26/2010 | Price change | $90,500+20.3%$84/sqft |
Source: foreclosure.com Report a problem | ||
| 3/21/2010 | Listed for sale | -- |
Source: foreclosure.com Report a problem | ||
| 3/1/2010 | Sold | $75,223+3%$70/sqft |
Source: Public Record Report a problem | ||
| 2/6/2010 | Price change | $73,000-8.6%$68/sqft |
Source: Windermere Dunnigan Realtors #10002034 Report a problem | ||
| 1/24/2010 | Price change | $79,900-2.6%$74/sqft |
Source: Windermere Dunnigan Realtors #10002034 Report a problem | ||
| 1/12/2010 | Price change | $82,000-13.7%$76/sqft |
Source: Windermere Dunnigan Realtors #10002034 Report a problem | ||
| 1/10/2010 | Listed for sale | $95,000+30.1%$88/sqft |
Source: Windermere Dunnigan Realtors #10002034 Report a problem | ||
| 10/6/2000 | Sold | $73,000+43.1%$68/sqft |
Source: Public Record Report a problem | ||
| 4/20/1998 | Sold | $51,000-44.9%$47/sqft |
Source: Public Record Report a problem | ||
| 8/5/1997 | Sold | $92,557$86/sqft |
Source: Public Record Report a problem | ||
Public tax history
| Year | Property taxes | Tax assessment |
|---|---|---|
| 2025 | $3,825 +14.1% | $220,868 +2% |
| 2024 | $3,352 -24.4% | $216,539 +2% |
| 2023 | $4,435 +34% | $212,294 +2% |
| 2022 | $3,311 +3% | $208,132 +2% |
| 2021 | $3,216 -10.4% | $204,052 +1% |
| 2020 | $3,587 +43.3% | $201,960 +2% |
| 2019 | $2,503 +133.5% | $198,000 +170.5% |
| 2018 | $1,072 +1.9% | $73,185 +2% |
| 2017 | $1,052 +2.7% | $71,751 +2% |
| 2016 | $1,024 +2.1% | $70,345 +1.5% |
| 2015 | $1,003 +1.6% | $69,289 +2% |
| 2014 | $988 | $67,932 +0.5% |
| 2013 | -- | $67,626 +11.9% |
| 2012 | -- | $60,450 -7% |
| 2011 | -- | $65,000 -11.5% |
| 2010 | -- | $73,455 -12.3% |
| 2008 | -- | $83,739 +2% |
| 2007 | -- | $82,098 +2% |
| 2006 | -- | $80,489 +2% |
| 2005 | -- | $78,912 +2% |
| 2004 | -- | $77,366 +1.9% |
| 2003 | -- | $75,949 +2% |
| 2002 | -- | $74,460 +2% |
| 2001 | -- | $73,000 +39.1% |
| 2000 | -- | $52,495 |
Find assessor info on the county website
Monthly payment
Estimated monthly payment$1,822
All calculations are estimates and provided by Zillow, Inc. for informational purposes only. Actual amounts may vary.
HOA fees may include property taxes on listings classified as Co-Ops. Contact the listing agent and/or owner for fee details.
Mortgage interest rates are dependent on a number of factors, including credit score, down payment, and repayment length. Interest rate data provided by Zillow Group Marketplace, Inc. as of 1/1/1970 from various mortgage lenders with which we have lead or other similar arrangements; the Estimated Payment is an average of those rates.
See how much you could borrow to make a competitive offer.
Climate risks
Neighborhood: Pocket
Nearby schools
GreatSchools rating
- 3/10Caroline Wenzel Elementary SchoolGrades: K-6Distance: 0.7 mi
- 3/10Sam Brannan Middle SchoolGrades: 7-8Distance: 2.1 mi
- 6/10John F. Kennedy High SchoolGrades: 9-12Distance: 0.3 mi


- California
- Sacramento County
- Sacramento
- 95831
- 1003 Roundtree Ct
Nearby cities
Nearby neighborhoods
Nearby zip codes
Other Sacramento Topics
