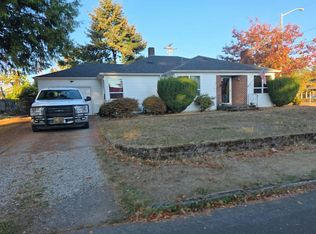
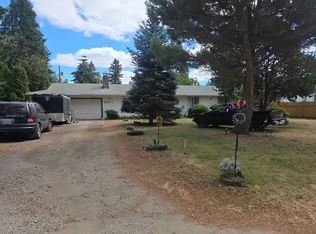
2 vehicle carport, workshop and 2 outbuildings, newer roof, partially fenced, shaded back yard.
Pre-foreclosure
Street View
Est. $331,400
10205 NE 7th St, Vancouver, WA 98664
2beds
1,152sqft
MobileManufactured
Built in 1979
8,476 Square Feet Lot
$331,400 Zestimate®
$288/sqft
$-- HOA
Overview
- 208 days
- 135
- 9
Facts & features
Interior
Bedrooms & bathrooms
- Bedrooms: 2
- Bathrooms: 2
- Full bathrooms: 2
Heating
- Forced air, Electric
Cooling
- None
Appliances
- Included: Dishwasher, Garbage disposal, Range / Oven, Refrigerator
Features
- Flooring: Carpet, Laminate, Linoleum / Vinyl
- Basement: None
- Has fireplace: No
Interior area
- Total interior livable area: 1,152 sqft
Property
Parking
- Total spaces: 2
- Parking features: Carport
Features
- Exterior features: Metal
- View description: None
Lot
- Size: 8,476 Square Feet
Details
- Parcel number: 110532258
Construction
Type & style
- Home type: MobileManufactured
Materials
- concrete
- Roof: Composition
Condition
- Year built: 1979
Community & HOA
Location
- Region: Vancouver
Financial & listing details
- Price per square foot: $288/sqft
- Tax assessed value: $244,077
- Annual tax amount: $2,476
Foreclosure details
Estimated market value
$331,400
$315,000 - $348,000
Not available
Price history
| Date | Event | Price |
|---|---|---|
| 7/14/2023 | Sold | $336,000+0.3%$292/sqft |
Source:  RMLS (OR) #23446928 Report a problem | ||
| 6/8/2023 | Pending sale | $335,000$291/sqft |
Source: RMLS (OR) #23446928 Report a problem | ||
| 6/1/2023 | Listed for sale | $335,000+191.3%$291/sqft |
Source: RMLS (OR) #23446928 Report a problem | ||
| 5/3/2004 | Sold | $115,000$100/sqft |
Source: Public Record Report a problem | ||
Public tax history
| Year | Property taxes | Tax assessment |
|---|---|---|
| 2025 | $2,476 +12.2% | $244,077 +10% |
| 2024 | $2,206 +2.1% | $221,904 -1.5% |
| 2023 | $2,161 +15.1% | $225,367 +0.2% |
| 2022 | $1,877 +15.1% | $224,841 +22.5% |
| 2021 | $1,631 +19.9% | $183,540 +21.7% |
| 2020 | $1,361 | $150,798 +18.8% |
| 2019 | $1,361 +24.8% | $126,978 +16% |
| 2018 | $1,090 -12.1% | $109,472 +9.4% |
| 2017 | $1,239 +19.9% | $100,105 +15.9% |
| 2016 | $1,034 +5.8% | $86,396 +10.5% |
| 2015 | $977 -9.1% | $78,181 -5% |
| 2014 | $1,075 | $82,274 +5% |
| 2013 | $1,075 -1.3% | $78,323 +8.2% |
| 2012 | $1,089 +2.1% | $72,378 -8.4% |
| 2011 | $1,067 +8.8% | $79,014 -1.4% |
| 2010 | $980 -19.5% | $80,130 -5.3% |
| 2009 | $1,218 | $84,580 -35.6% |
| 2008 | -- | $131,400 |
| 2007 | -- | $131,400 +63% |
| 2005 | -- | $80,600 |
| 2004 | -- | $80,600 +7.6% |
| 2001 | $676 +1.6% | $74,900 |
| 2000 | $666 | $74,900 |
Find assessor info on the county website
Monthly payment
Climate risks
Neighborhood: Marrion


Similar homes
- $--3 bd2 ba1.3k sqft211 NE 149th Ave, Vancouver, WA 98684Auction
 Auction.com 2
- $--2 bd1 ba1.1k sqft3926 F St, Vancouver, WA 98663Auction
 Auction.com 2
- $--3 bd2 ba1.1k sqft4511 NE 129th Ave, Vancouver, WA 98682Auction
 Auction.com 2
- $--3 bd2 ba1.2k sqft14103 SE 17th St, Vancouver, WA 98683Auction
 Auction.com 2
- $334,5003 bd1 ba1.1k sqft3507 R St, Vancouver, WA 98663Active
 MLS ID #402212390, Alexandra Starrett, Keller Williams Sunset Corridor. RMLS (OR)
- $325,0003 bd1 ba1k sqft3509 V St, Vancouver, WA 98663ActiveMLS ID #181115271, Richard Arkell, Coldwell Banker Bain. RMLS (OR)
- $425,0003 bd2 ba1.5k sqft8330 NE 16th St, Vancouver, WA 98664ActiveMLS ID #297069304, Layne Bouche, Realty One Group Prestige. RMLS (OR)
- $285,0002 bd1 ba640 sqft1808 NE 114th Pl, Portland, OR 97220ActiveMLS ID #282586016, Rashelle Newmyer, Coldwell Banker Professional. RMLS (OR)
- $329,9002 bd2 ba958 sqft4556 NE 97th Ave, Portland, OR 97220ActiveMLS ID #225402943, Dan McCrea, D&D Realty LLC. RMLS (OR)
- $407,5004 bd2 ba1.4k sqft614 NE 132nd Ave, Vancouver, WA 98684ActiveMLS ID #300598351, Mike Lamb, Windermere Northwest Living. RMLS (OR)
- $440,0003 bd2 ba1.3k sqft3409 NE 119th Ave, Vancouver, WA 98682ActiveMLS ID #544244131, Annette Chapman, Berkshire Hathaway HomeServices NW Real Estate. RMLS (OR)
