This 1381 square foot single family home has 4 bedrooms and 2.0 bathrooms. This home is located at 1031 Denver Pl, Oxnard, CA 93033.
Pre-foreclosure
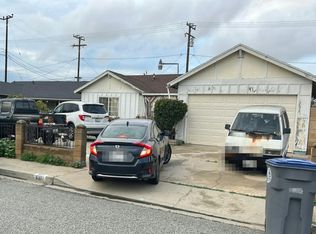
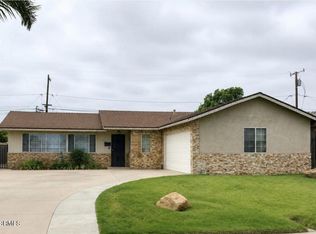
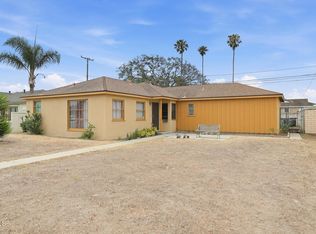
Street View
Est. $776,800
1031 Denver Pl, Oxnard, CA 93033
4beds
2baths
1,381sqft
SingleFamily
Built in 1969
9,583 Square Feet Lot
$776,800 Zestimate®
$562/sqft
$-- HOA
Overview
- 193 days |
- 16 |
- 0 |
Facts & features
Interior
Bedrooms & bathrooms
- Bedrooms: 4
- Bathrooms: 2
Interior area
- Total interior livable area: 1,381 sqft
Property
Parking
- Parking features: Garage - Attached
Lot
- Size: 9,583 Square Feet
Details
- Parcel number: 2210052095
Construction
Type & style
- Home type: SingleFamily
Condition
- Year built: 1969
Community & HOA
Location
- Region: Oxnard
Financial & listing details
- Price per square foot: $562/sqft
- Tax assessed value: $452,622
- Annual tax amount: $5,519
Visit our professional directory to find a foreclosure specialist in your area that can help with your home search.
Find a foreclosure agentForeclosure details
Estimated market value
$776,800
$738,000 - $816,000
$3,807/mo
Price history
| Date | Event | Price |
|---|---|---|
| 1/5/2017 | Sold | $390,000-27.8%$282/sqft |
Source: Public Record Report a problem | ||
| 8/8/2006 | Sold | $540,000+20%$391/sqft |
Source: Public Record Report a problem | ||
| 12/6/2004 | Sold | $450,000+233.3%$326/sqft |
Source: Public Record Report a problem | ||
| 4/22/1996 | Sold | $135,000+8%$98/sqft |
Source: Public Record Report a problem | ||
| 1/29/1996 | Sold | $125,000$91/sqft |
Source: Public Record Report a problem | ||
Public tax history
| Year | Property taxes | Tax assessment |
|---|---|---|
| 2025 | $5,519 +8.1% | $452,622 +2% |
| 2024 | $5,106 | $443,748 +2% |
| 2023 | $5,106 +2.1% | $435,048 +2% |
| 2022 | $5,001 -1.2% | $426,518 +2% |
| 2021 | $5,063 -1.8% | $418,155 +1% |
| 2020 | $5,156 +3.1% | $413,869 +2% |
| 2019 | $5,001 -5.3% | $405,755 +2% |
| 2018 | $5,284 +7.4% | $397,800 -3.4% |
| 2017 | $4,921 +5.2% | $412,000 +2.2% |
| 2016 | $4,677 +0.7% | $403,000 +3.9% |
| 2015 | $4,643 +38.2% | $388,000 +39.1% |
| 2014 | $3,361 | $279,000 -1.4% |
| 2013 | -- | $283,000 +5.2% |
| 2012 | -- | $269,000 -0.7% |
| 2011 | -- | $271,000 +6.7% |
| 2009 | -- | $254,000 -53% |
| 2007 | -- | $540,000 +17.6% |
| 2006 | -- | $459,000 +2% |
| 2005 | -- | $450,000 +190.6% |
| 2003 | -- | $154,841 +2% |
| 2002 | -- | $151,806 +2% |
| 2001 | $1,625 +1.6% | $148,831 +2% |
| 2000 | $1,599 | $145,914 |
Find assessor info on the county website
Monthly payment
Estimated monthly payment$1,822
All calculations are estimates and provided by Zillow, Inc. for informational purposes only. Actual amounts may vary.
HOA fees may include property taxes on listings classified as Co-Ops. Contact the listing agent and/or owner for fee details.
Mortgage interest rates are dependent on a number of factors, including credit score, down payment, and repayment length. Interest rate data provided by Zillow Group Marketplace, Inc. as of 1/1/1970 from various mortgage lenders with which we have lead or other similar arrangements; the Estimated Payment is an average of those rates.
See how much you could borrow to make a competitive offer.
Climate risks
Neighborhood: College Estates
Nearby schools
GreatSchools rating
- 4/10Fred L. Williams Elementary SchoolGrades: K-5Distance: 0.6 mi
- 3/10Charles Blackstock Junior High SchoolGrades: 6-8Distance: 0.6 mi
- 4/10Channel Islands High SchoolGrades: 9-12Distance: 0.1 mi

- California
- Ventura County
- Oxnard
- 93033
- College Estates
- 1031 Denver Pl
Nearby cities
Nearby neighborhoods
Nearby zip codes
Other Oxnard Topics
