Nice home with on Detroit's east side. Schedule your showing today!
BATVAI
For sale
$75,000
10935 Marne St, Detroit, MI 48224
3beds
1,837sqft
Single Family Residence
Built in 1943
5,227 Square Feet Lot
$-- Zestimate®
$41/sqft
$-- HOA
What's special
- 9 days
- 302
- 44
Likely to sell faster than
Zillow last checked:
Listing updated:
Listed by:
Lashawn Peterson 888-501-7085,
EXP Realty Main 888-501-7085,
Bernadine Jordan 888-501-7085,
EXP Realty Main
Source: Realcomp II,MLS#: 20261091001
Facts & features
Interior
Bedrooms & bathrooms
- Bedrooms: 3
- Bathrooms: 1
- Full bathrooms: 1
Bedroom
- Level: Entry
- Area: 100
- Dimensions: 10 X 10
Bedroom
- Level: Entry
- Area: 100
- Dimensions: 10 X 10
Bedroom
- Level: Second
- Area: 384
- Dimensions: 24 X 16
Other
- Level: Entry
Kitchen
- Level: Entry
- Area: 100
- Dimensions: 10 X 10
Living room
- Level: Entry
- Area: 120
- Dimensions: 12 X 10
Heating
- Forced Air, Natural Gas
Features
- Basement: Partially Finished
- Has fireplace: No
Interior area
- Total interior livable area: 1,837 sqft
- Finished area above ground: 1,024
- Finished area below ground: 813
Property
Parking
- Total spaces: 1
- Parking features: One Car Garage, Detached
- Garage spaces: 1
Features
- Levels: One And One Half
- Stories: 1.5
- Entry location: GroundLevelwSteps
- Patio & porch: Covered
- Pool features: None
Lot
- Size: 5,227 Square Feet
- Dimensions: 43 x 125.72
Details
- Parcel number: W21I068491S
- Special conditions: Short Sale No,Standard
Construction
Type & style
- Home type: SingleFamily
- Architectural style: Bungalow
- Property subtype: Single Family Residence
Materials
- Brick
- Foundation: Basement, Brick Mortar, Poured
- Roof: Asphalt
Condition
- New construction: No
- Year built: 1943
Utilities & green energy
- Sewer: Public Sewer
- Water: Public
Community & HOA
Community
- Subdivision: PARK DRIVE 4
HOA
- Has HOA: No
Location
- Region: Detroit
Financial & listing details
- Price per square foot: $41/sqft
- Tax assessed value: $15,561
- Annual tax amount: $3,016
- Date on market: 11/12/2026
- Cumulative days on market: 9 days
- Listing agreement: Exclusive Right To Sell
- Listing terms: Cash,Conventional
Estimated market value
Not available
Estimated sales range
Not available
$1,254/mo
Price history
| Date | Event | Price |
|---|---|---|
| 11/17/2026 | Listing removed | $1,350$1/sqft |
Source: Zillow Rentals Report a problem | ||
| 11/12/2026 | Listed for sale | $75,000+66.7%$41/sqft |
Source:  Realcomp II #20261091001 Report a problem | ||
| 10/12/2026 | Price change | $1,350+3.8%$1/sqft |
Source: Zillow Rentals Report a problem | ||
| 9/24/2026 | Listed for rent | $1,300$1/sqft |
Source: Zillow Rentals Report a problem | ||
| 6/29/2026 | Listing removed | $1,300$1/sqft |
Source: Zillow Rentals Report a problem | ||
| 6/9/2026 | Price change | $1,300+8.3%$1/sqft |
Source: Zillow Rentals Report a problem | ||
| 4/30/2026 | Listed for rent | $1,200$1/sqft |
Source: Zillow Rentals Report a problem | ||
| 2/11/2026 | Listing removed | $1,200$1/sqft |
Source: Zillow Rentals Report a problem | ||
| 11/15/2025 | Listed for rent | $1,200-7.7%$1/sqft |
Source: Zillow Rentals Report a problem | ||
| 8/12/2025 | Listing removed | $1,300$1/sqft |
Source: Zillow Rentals Report a problem | ||
| 7/23/2025 | Listed for rent | $1,300+4%$1/sqft |
Source: Zillow Rentals Report a problem | ||
| 5/2/2025 | Listing removed | $1,250$1/sqft |
Source: Zillow Rentals Report a problem | ||
| 2/20/2025 | Listed for rent | $1,250+4.2%$1/sqft |
Source: Zillow Rentals Report a problem | ||
| 10/26/2023 | Listing removed | -- |
Source: Zillow Rentals Report a problem | ||
| 10/5/2023 | Listed for rent | $1,200+9.1%$1/sqft |
Source: Zillow Rentals Report a problem | ||
| 9/4/2023 | Listing removed | -- |
Source: Zillow Rentals Report a problem | ||
| 8/14/2023 | Listed for rent | $1,100-12%$1/sqft |
Source: Zillow Rentals Report a problem | ||
| 5/22/2023 | Listing removed | -- |
Source: Zillow Rentals Report a problem | ||
| 4/4/2023 | Listed for rent | $1,250$1/sqft |
Source: Zillow Rentals Report a problem | ||
| 3/18/2023 | Listing removed | -- |
Source: Zillow Rentals Report a problem | ||
| 2/8/2023 | Listed for rent | $1,250+76.1%$1/sqft |
Source: Zillow Rentals Report a problem | ||
| 7/8/2022 | Listing removed | $44,990$24/sqft |
Source:  MiRealSource #50079944 Report a problem | ||
| 6/23/2022 | Listed for sale | $44,990+274.9%$24/sqft |
Source: MiRealSource #50079944 Report a problem | ||
| 3/31/2016 | Listing removed | $710-11.3% |
Source: the RI Group Report a problem | ||
| 8/12/2015 | Listing removed | $800 |
Source: the RI Group Report a problem | ||
| 11/17/2008 | Sold | $12,000-90%$7/sqft |
Source: Public Record Report a problem | ||
| 1/22/2008 | Sold | $119,962+34.8%$65/sqft |
Source: Public Record Report a problem | ||
| 8/19/2002 | Sold | $89,000$48/sqft |
Source: Public Record Report a problem | ||
Public tax history
| Year | Property taxes | Tax assessment |
|---|---|---|
| 2026 | -- | $40,900 +7.1% |
| 2025 | -- | $38,200 +36.9% |
| 2024 | -- | $27,900 +24% |
| 2023 | -- | $22,500 +23.6% |
| 2022 | -- | $18,200 +7.1% |
| 2021 | -- | $17,000 |
| 2020 | $1,989 +53.6% | $17,000 +25.9% |
| 2019 | $1,295 | $13,500 +10.7% |
| 2018 | $1,295 | $12,200 -2.4% |
| 2017 | -- | $12,500 -25.6% |
| 2016 | $2,521 | $16,800 |
| 2015 | $2,521 +8.3% | $16,800 -27.9% |
| 2013 | $2,329 -7.6% | $23,288 -31.8% |
| 2010 | $2,521 | $34,143 -12% |
| 2009 | -- | $38,799 -13.5% |
| 2008 | -- | $44,854 |
| 2007 | -- | $44,854 +5.5% |
| 2005 | $496 | $42,516 +3% |
| 2004 | -- | $41,278 +26.2% |
| 2001 | $2,724 +81.7% | $32,714 +70.3% |
| 2000 | $1,499 | $19,214 |
Find assessor info on the county website
Monthly payment
Est. payment
Payment breakdown
Explore the cost of this home by adjusting the details. Changes won't be saved.Climate risks
Neighborhood: Moross-Morang
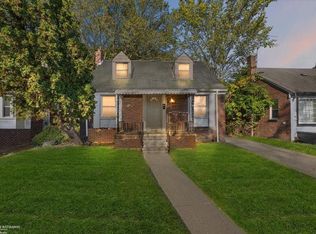
Similar homes
- $75,0003 bd1 ba1.1k sqft10991 Roxbury St, Detroit, MI 48224For Sale
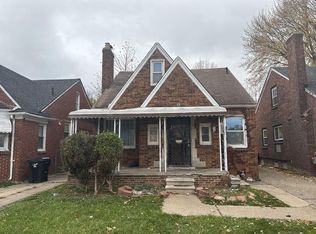
 MLS ID #26061212, Charles Campbell, ListWithFreedom.com. MichRIC
- $65,0003 bd2 ba1.4k sqft12225 Lansdowne St, Detroit, MI 48224For Sale
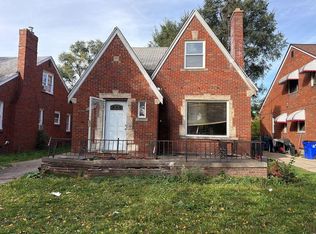 MLS ID #26059357, Charles Campbell, ListWithFreedom.com. MichRIC
- $65,0003 bd2 ba1.1k sqft12260 Wayburn St, Detroit, MI 48224For Sale

 MLS ID #20261091269, Andreina Mendoza-Herrera, RE/MAX Leading Edge. Realcomp II
- $79,0003 bd1 ba1.2k sqft11784 Rossiter St, Detroit, MI 48224For Sale
 MLS ID #20261085570, Ligia M Godoy, CMB Real Estate. Realcomp II
- $70,0003 bd1 ba1.2k sqft10561 Marne St, Detroit, MI 48224For SaleMLS ID #20261086613, Christopher Davenport, Front Page Properties. Realcomp II
- $62,9003 bd1 ba1k sqft10720 Balfour Rd, Detroit, MI 48224For SaleMLS ID #20261092526, Greg Majewski, Detroit Investment Company. Realcomp II
- $84,9004 bd2 ba2k sqft18418-18422 Kelly Rd, Detroit, MI 48224For SaleMLS ID #20261093369, Sherri Saad, RE/MAX Leading Edge. Realcomp II
- $79,0003 bd1 ba1k sqft12566 Duchess St, Detroit, MI 48224For SaleMLS ID #20261088692, Anthony Vitale, Realty Executives Home Towne. Realcomp II
- $75,0003 bd1 ba1.1k sqft10755 Roxbury St, Detroit, MI 48224For SaleMLS ID #20261087719, David Rabior, Clyde Realty LLC. Realcomp II
- $85,0003 bd1 ba1k sqft10434 Morang Dr, Detroit, MI 48224For SaleMLS ID #20261091047, Ligia M Godoy, CMB Real Estate. Realcomp II
- $80,0003 bd1 ba1.1k sqft11712 Wayburn St, Detroit, MI 48224For SaleMLS ID #20261083004, Sotero M Lopez II, EXP Realty Main. Realcomp II
- $80,0003 bd1 ba1k sqft12485 Whitehill St, Detroit, MI 48224For SaleMLS ID #20261090265, Tomer Chen, Brookstone, Realtors LLC. Realcomp II
- $75,0003 bd1 ba1.5k sqft12830 Riad St, Detroit, MI 48224For SaleMLS ID #20261043390, Angela Washington, Rondo Investment LLC. Realcomp II
- $75,0003 bd1 ba1k sqft9345 Courville St, Detroit, MI 48224For SaleMLS ID #20261084860, Ligia M Godoy, CMB Real Estate. Realcomp II
- $85,5003 bd1 ba932 sqft5344 Hereford St, Detroit, MI 48224For SaleMLS ID #20261089968, Leah G Sohlden, Century 21 Curran & Oberski. Realcomp II
- $85,0003 bd1 ba1.1k sqft10925 Marne St, Detroit, MI 48224For Sale
 MLS ID #50225118, Bradford Lack, Berkshire Hathaway HomeServices Kee Realty SCS. MiRealSource
- $79,0003 bd2 ba924 sqft10742 Balfour Rd, Detroit, MI 48224For SaleMLS ID #20261059500, Scott D MacDonald, Tradewinds Development Group, LLC. Realcomp II
- $65,0003 bd1 ba1k sqft5415 Hereford St, Detroit, MI 48224For SaleMLS ID #20261089501, James Munro, Gateway Property Group. Realcomp II
- $77,9003 bd1 ba1k sqft10973 Roxbury St, Detroit, MI 48224For SaleMLS ID #20261068060, Mark Hutter, Detroit Investment Company. Realcomp II
