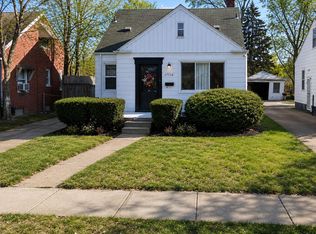
3-bedroom, 1-bathroom single-family home . Perfect for first-time buyers, investors, or anyone looking for an affordable opportunity in an up-and-coming offering flexibility for family, guests, or home office space This home is located in Detroit!!!
For sale
$79,000
11784 Rossiter St, Detroit, MI 48224
3beds
1,240sqft
Single Family Residence
Built in 1941
4,791 Square Feet Lot
$-- Zestimate®
$64/sqft
$-- HOA
What's special
- 22 days
- 289
- 22
Zillow last checked:
Listing updated:
Listed by:
Ligia M Godoy 313-301-4899,
CMB Real Estate 313-228-5492
Source: Realcomp II,MLS#: 20261085570
Facts & features
Interior
Bedrooms & bathrooms
- Bedrooms: 3
- Bathrooms: 1
- Full bathrooms: 1
Bedroom
- Level: Entry
- Area: 121
- Dimensions: 11 X 11
Bedroom
- Level: Second
- Area: 192
- Dimensions: 12 X 16
Bedroom
- Level: Entry
- Area: 121
- Dimensions: 11 X 11
Other
- Level: Entry
- Area: 42
- Dimensions: 6 X 7
Dining room
- Level: Entry
- Area: 121
- Dimensions: 11 X 11
Kitchen
- Level: Entry
- Area: 110
- Dimensions: 10 X 11
Living room
- Level: Entry
- Area: 168
- Dimensions: 12 X 14
Heating
- Forced Air, Natural Gas
Features
- Basement: Unfinished
- Has fireplace: No
Interior area
- Total interior livable area: 1,240 sqft
- Finished area above ground: 1,240
Property
Parking
- Parking features: No Garage
Features
- Levels: One And One Half
- Stories: 1.5
- Entry location: GroundLevelwSteps
- Pool features: None
Lot
- Size: 4,791 Square Feet
- Dimensions: 40 x 123.45
Details
- Parcel number: W21I058666S
- Special conditions: Short Sale No,Standard
Construction
Type & style
- Home type: SingleFamily
- Architectural style: Bungalow
- Property subtype: Single Family Residence
Materials
- Brick
- Foundation: Basement, Brick Mortar
Condition
- New construction: No
- Year built: 1941
Utilities & green energy
- Sewer: Sewer At Street
- Water: Waterat Street
Community & HOA
Community
- Subdivision: PARK DRIVE 6
HOA
- Has HOA: No
Location
- Region: Detroit
Financial & listing details
- Price per square foot: $64/sqft
- Tax assessed value: $12,836
- Annual tax amount: $1,937
- Date on market: 10/30/2026
- Cumulative days on market: 22 days
- Listing agreement: Exclusive Right To Sell
- Listing terms: Cash,Conventional
Estimated market value
Not available
Estimated sales range
Not available
$1,394/mo
Price history
| Date | Event | Price |
|---|---|---|
| 10/30/2026 | Listed for sale | $79,000+5.3%$64/sqft |
Source:  Realcomp II #20261085570 Report a problem | ||
| 8/19/2020 | Sold | $75,000+87.5%$60/sqft |
Source: Public Record Report a problem | ||
| 6/3/2019 | Sold | $40,000+332.4%$32/sqft |
Source: Public Record Report a problem | ||
| 5/24/2017 | Listing removed | $650$1/sqft |
Source: dbc Property Management Report a problem | ||
| 4/25/2017 | Listed for rent | $650$1/sqft |
Source: dbc Property Management Report a problem | ||
| 3/20/2017 | Listing removed | $650$1/sqft |
Source: dbc Property Management Report a problem | ||
| 2/16/2017 | Listed for rent | $650$1/sqft |
Source: dbc Property Management Report a problem | ||
| 2/4/2015 | Listing removed | $650$1/sqft |
Source: Jefferson Property Management Report a problem | ||
| 10/23/2014 | Listed for rent | $650$1/sqft |
Source: Jefferson Property Management Report a problem | ||
| 3/16/2009 | Sold | $9,250-86.7%$7/sqft |
Source: Public Record Report a problem | ||
| 8/21/2008 | Sold | $69,637+132.1%$56/sqft |
Source: Public Record Report a problem | ||
| 10/22/2007 | Sold | $30,000-72.7%$24/sqft |
Source: Public Record Report a problem | ||
| 7/5/2005 | Sold | $110,000+65.3%$89/sqft |
Source: Public Record Report a problem | ||
| 4/1/2005 | Sold | $66,532-30.1%$54/sqft |
Source: Public Record Report a problem | ||
| 5/10/2004 | Sold | $95,219+3.5%$77/sqft |
Source: Public Record Report a problem | ||
| 8/15/2003 | Sold | $92,000+167.7%$74/sqft |
Source: Public Record Report a problem | ||
| 8/29/2002 | Sold | $34,365$28/sqft |
Source: Public Record Report a problem | ||
Public tax history
| Year | Property taxes | Tax assessment |
|---|---|---|
| 2026 | -- | $15,000 -30.2% |
| 2025 | -- | $21,500 +37.8% |
| 2024 | -- | $15,600 +13.9% |
| 2023 | -- | $13,700 +22.3% |
| 2022 | -- | $11,200 +6.7% |
| 2021 | -- | $10,500 |
| 2020 | $634 -29.3% | $10,500 +23.5% |
| 2019 | $897 | $8,500 +11.8% |
| 2018 | $897 | $7,600 -1.3% |
| 2017 | -- | $7,700 -56.3% |
| 2016 | $2,631 | $17,600 |
| 2015 | $2,631 +7.8% | $17,600 -27.9% |
| 2013 | $2,441 -7.2% | $24,414 -31.8% |
| 2010 | $2,631 | $35,794 -12% |
| 2009 | -- | $40,675 -13.5% |
| 2008 | -- | $47,023 |
| 2007 | -- | $47,023 +5.5% |
| 2005 | $541 | $44,572 +3% |
| 2004 | -- | $43,274 +122.1% |
| 2001 | $1,268 +12.2% | $19,481 +3.2% |
| 2000 | $1,130 | $18,877 |
Find assessor info on the county website
Monthly payment
Est. payment
Payment breakdown
Explore the cost of this home by adjusting the details. Changes won't be saved.Climate risks
Neighborhood: Moross-Morang
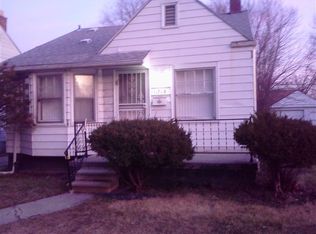
Similar homes
- $85,0003 bd1 ba1k sqft10434 Morang Dr, Detroit, MI 48224For Sale
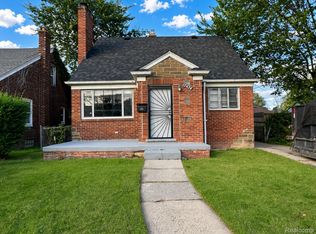
 MLS ID #20261091047, Ligia M Godoy, CMB Real Estate. Realcomp II
- $65,0003 bd2 ba1.4k sqft12225 Lansdowne St, Detroit, MI 48224For Sale
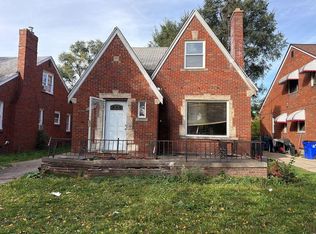
 MLS ID #26059357, Charles Campbell, ListWithFreedom.com. MichRIC
- $89,9003 bd1 ba1.1k sqft15449 Bringard Dr, Detroit, MI 48205For Sale
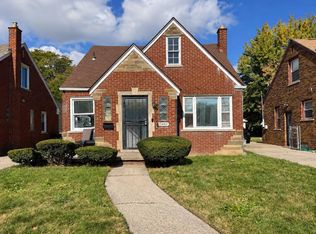 MLS ID #26060734, Kristian Freiwald, Domus Realty. MichRIC
- $90,0003 bd2 ba1.3k sqft5791 Whittier St, Detroit, MI 48224For Sale
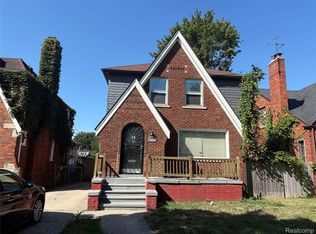 MLS ID #20261069431, Benjamin Ness, Clyde Realty LLC. Realcomp II
- $65,0003 bd1 ba1.5k sqft5570 Farmbrook St, Detroit, MI 48224For Sale
 MLS ID #50225267, Bradford Lack, Berkshire Hathaway HomeServices Kee Realty SCS. MiRealSource
- $79,0003 bd1 ba1.1k sqft11227 Minden St, Detroit, MI 48205For SaleMLS ID #20261085467, Ligia M Godoy, CMB Real Estate. Realcomp II
- $94,0003 bd2 ba1.3k sqft5809 Courville St, Detroit, MI 48224For SaleMLS ID #20261080046, Dana Politi-Rashid, Cobb Realty Group. Realcomp II
- $75,0003 bd1 ba1k sqft19934 Westphalia St, Detroit, MI 48205For SaleMLS ID #20261085585, Ligia M Godoy, CMB Real Estate. Realcomp II
- $65,0003 bd1 ba1.1k sqft9180 Devonshire Rd, Detroit, MI 48224For SaleMLS ID #20261072544, Justin Fontenelle, Realtyflo Inc. Realcomp II
- $85,9003 bd1 ba1.6k sqft16631 Collingham Dr, Detroit, MI 48205For SaleMLS ID #20261082656, Henry Manning, Keller Williams Realty-Great Lakes. Realcomp II
- $79,0004 bd2 ba1.7k sqft15376 Prest St, Detroit, MI 48227For SaleMLS ID #26060987, Zena Berri, U.S. Investor Group. MichRIC
- $78,0004 bd2 ba1.2k sqft13892 Eastburn St, Detroit, MI 48205For SaleMLS ID #20261064980, Kimberly Young, Golden Eagle Real Estate LLC. Realcomp II
- $64,9002 bd1 ba1k sqft10342 Roxbury St, Detroit, MI 48224For SaleMLS ID #20261078413, David Rabior, Clyde Realty LLC. Realcomp II
- $90,0003 bd1 ba1k sqft15309 Troester St, Detroit, MI 48205For SaleMLS ID #20261081774, LaCretia Baldwin, EXP Realty Main. Realcomp II
- $75,0003 bd1 ba1.2k sqft5579 Lenox St, Detroit, MI 48213For SaleMLS ID #20261066891, Hassan Hammoud, U.S. Investor Group. Realcomp II
- $82,5003 bd1 ba1k sqft11791 Nashville St, Detroit, MI 48205For SaleMLS ID #20261064860, Joseph Hammel, Keller Williams Somerset. Realcomp II
- $70,0003 bd2 ba941 sqft19510 Dresden St, Detroit, MI 48205For SaleMLS ID #20261084575, David Binkley Jr, Real Broker LLC - The Binkley Group. Realcomp II
- $80,0002 bd1 ba850 sqft18151 Orleans St, Detroit, MI 48203For SaleMLS ID #20261090882, Ligia M Godoy, CMB Real Estate. Realcomp II
- $72,0003 bd2 ba1k sqft13801 Fordham St, Detroit, MI 48205For SaleMLS ID #20261053577, Randi Schmidt, Keller Williams Realty-Great Lakes. Realcomp II
- $74,9002 bd2 ba997 sqft11828 College St, Detroit, MI 48205For SaleMLS ID #26051421, Stacey Leid, Grant and Main, LLC. MichRIC
