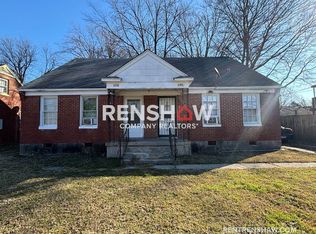
PRIME INVESTMENT PACKAGE DEAL: Three income-producing properties (1004-1006 Highland Ave, 1096-1098 Gordon Ave, and 540-542Berclair RD) for 520,000. Generating $5700 monthly with long-term tenants already in place, offering immediate cash flow and steady returns. Ideal for investors, SOLD AS A PACKAGE ONLY.
For sale
Price cut: $2K (5/9)
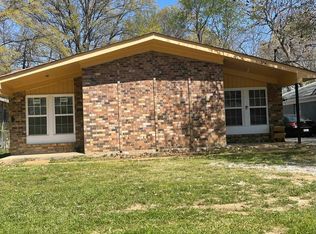
$173,000
1096 Gordon St, Memphis, TN 38122
4beds
1,841sqft
Duplex
Built in 1947
-- sqft lot
$-- Zestimate®
$94/sqft
$-- HOA
What's special
- 65 days |
- 64 |
- 4 |
Zillow last checked:
Listing updated:
Listed by:
Elizabeth Castillo,
BEST Real Estate Company 901-407-2177
Source: MAAR,MLS#: 10220470
Loading...
Facts & features
Interior
Bedrooms & bathrooms
- Bedrooms: 4
- Bathrooms: 2
- Full bathrooms: 2
Heating
- Central
Cooling
- Central Air
Appliances
- Included: Gas Water Heater
Features
- Separate Living Room
- Flooring: Hardwood
Interior area
- Total interior livable area: 1,841 sqft
Property
Parking
- Parking features: Driveway/Pad
- Has uncovered spaces: Yes
Features
- Stories: 1
- Pool features: None
Lot
- Size: 7,560 Square Feet
- Dimensions: 60 x 126
- Features: Level
Details
- Parcel number: 043066 00074
Construction
Type & style
- Home type: MultiFamily
- Architectural style: Traditional
- Property subtype: Duplex
Materials
- Brick Veneer
Condition
- Year built: 1947
Community & HOA
Community
- Subdivision: Runnimeade 1st Addn
Location
- Region: Memphis
Financial & listing details
- Price per square foot: $94/sqft
- Tax assessed value: $74,400
- Annual tax amount: $1,569
- Date on market: 4/30/2026
- Cumulative days on market: 65 days
- Listing terms: Conventional
- Lease term: 12 Months
Estimated market value
Not available
Estimated sales range
Not available
$1,032/mo
Price history
| Date | Event | Price |
|---|---|---|
| 5/9/2026 | Price change | $173,000-1.1%$94/sqft |
Source: | ||
| 4/30/2026 | Listed for sale | $175,000+59.1%$95/sqft |
Source: | ||
| 1/31/2025 | Sold | $110,000$60/sqft |
Source: | ||
| 1/13/2025 | Pending sale | $110,000$60/sqft |
Source: | ||
| 1/9/2025 | Listed for sale | $110,000+107.5%$60/sqft |
Source: | ||
| 6/5/2024 | Listing removed | -- |
Source: Zillow Rentals Report a problem | ||
| 5/29/2024 | Price change | $595-8.5% |
Source: Zillow Rentals Report a problem | ||
| 5/7/2024 | Listed for rent | $650 |
Source: Zillow Rentals Report a problem | ||
| 4/25/2024 | Listing removed | -- |
Source: Zillow Rentals Report a problem | ||
| 4/17/2024 | Price change | $650-13.3% |
Source: Zillow Rentals Report a problem | ||
| 3/5/2024 | Listed for rent | $750-5.7% |
Source: Zillow Rentals Report a problem | ||
| 1/20/2023 | Listing removed | -- |
Source: Zillow Rentals Report a problem | ||
| 1/4/2023 | Price change | $795-9.1% |
Source: Zillow Rentals Report a problem | ||
| 12/1/2022 | Listed for rent | $875+46.1% |
Source: Zillow Rental Network Premium Report a problem | ||
| 10/15/2020 | Listing removed | $599 |
Source: Renshaw Property Management Report a problem | ||
| 9/29/2020 | Price change | $599-7.8% |
Source: Renshaw Property Management Report a problem | ||
| 9/4/2020 | Listed for rent | $650 |
Source: Renshaw Property Management Report a problem | ||
| 12/6/2019 | Sold | $53,000+103.8%$29/sqft |
Source: Public Record Report a problem | ||
| 3/19/2015 | Sold | $26,000-11.9%$14/sqft |
Source: Public Record Report a problem | ||
| 2/14/2015 | Listed for sale | $29,500$16/sqft |
Source: Owner Report a problem | ||
Public tax history
| Year | Property taxes | Tax assessment |
|---|---|---|
| 2025 | $1,569 +43.5% | $29,760 +79.3% |
| 2024 | $1,093 +8.1% | $16,600 |
| 2023 | $1,011 | $16,600 |
| 2022 | -- | $16,600 |
| 2021 | -- | $16,600 -6.3% |
| 2020 | $566 | $17,720 |
| 2019 | $566 -21.1% | $17,720 |
| 2018 | $718 -45.1% | $17,720 |
| 2017 | $1,308 +62.2% | $17,720 -25.3% |
| 2016 | $806 -14.3% | $23,720 |
| 2014 | $941 | $23,720 |
| 2013 | -- | $23,720 -19.6% |
| 2012 | -- | $29,520 |
| 2011 | -- | $29,520 |
| 2010 | -- | $29,520 |
| 2009 | -- | $29,520 +10.8% |
| 2008 | -- | $26,640 |
| 2007 | -- | $26,640 |
| 2006 | -- | $26,640 |
| 2005 | -- | $26,640 +8.6% |
| 2004 | -- | $24,520 |
| 2003 | -- | $24,520 |
| 2002 | -- | $24,520 |
| 2001 | -- | $24,520 -6.4% |
| 2000 | -- | $26,200 |
Find assessor info on the county website
Monthly payment
Est. payment$--/mo
Payment breakdown
Explore the cost of this home by adjusting the details. Changes won't be saved.All calculations are estimates and provided by Zillow, Inc. for informational purposes only. Actual amounts may vary.
HOA fees may include property taxes on listings classified as Co-Ops. Contact the listing agent and/or owner for fee details.
Mortgage interest rates are dependent on a number of factors, including credit score, down payment, and repayment length. Interest rate data provided by Zillow Group Marketplace, Inc. as of 1/1/1970 from various mortgage lenders with which we have lead or other similar arrangements; the Estimated Payment is an average of those rates.
See how much you could borrow to make a competitive offer.
Climate risks
Neighborhood: Berclair-Highland Heights
Nearby schools
GreatSchools rating
- 3/10Treadwell Elementary SchoolGrades: PK-5Distance: 0.3 mi
- 5/10Treadwell Middle SchoolGrades: 6-8Distance: 0.3 mi
- 3/10Kingsbury High SchoolGrades: 9-12Distance: 1 mi
A local agent can set up tours, give advice and negotiate with sellers.
Nearby cities
Nearby neighborhoods
- Cordova-Appling Real estate
- Downtown Real estate
- East Memphis-Colonial-Yorkshire Real estate
- Hickory Ridge-South Riverdale Real estate
- Midtown Real estate
- Parkway Village-Oakhaven Real estate
- Raleigh Real estate
- River Oaks-Kirby-Balmoral Real estate
- Shelby Forest-Frayser Real estate
- White Haven-Coro Lake Real estate
Nearby zip codes
Other Memphis Topics
