Ideal investment opportunity for investors or owner occupants! Nestled in the hills of Fitchburg, this quiet three-family home offers the perfect balance of natural tranquility and great investment potential. The updated 2 bedroom units each offer comfortable and spacious layouts. The first-floor unit with be delivered vacant at closing making this an ideal opportunity for an owner-occupant looking to generate rental income or an investor ready to set market rates immediately. Separate utilities and lead certificates of compliance in hand! Don't miss it!
For sale
Price cut: $9.1K (9/29)
$589,900
11 Nutting St, Fitchburg, MA 01420
6beds
3,150sqft
3 Family
Built in 1900
-- sqft lot
$584,500 Zestimate®
$187/sqft
$-- HOA
What's special
Comfortable and spacious layouts
- 36 days
- 336
- 19
Zillow last checked:
Listing updated:
Listed by:
Nicholas L. Pelletier 978-674-7146,
Keller Williams Realty North Central 978-840-9000
Source: MLS PIN,MLS#: 73576281
Facts & features
Interior
Bedrooms & bathrooms
- Bedrooms: 6
- Bathrooms: 3
- Full bathrooms: 3
Features
- Living Room, Kitchen
- Basement: Full,Unfinished
- Has fireplace: No
Interior area
- Total structure area: 3,150
- Total interior livable area: 3,150 sqft
- Finished area above ground: 3,150
Property
Parking
- Total spaces: 3
- Parking features: Paved Drive, Off Street
- Uncovered spaces: 3
Features
- Patio & porch: Deck
- Has view: Yes
- View description: City View(s)
Lot
- Size: 7,200 Square Feet
- Features: Wooded
Details
- Parcel number: 1502329
- Zoning: RB
Construction
Type & style
- Home type: MultiFamily
- Property subtype: 3 Family
Materials
- Frame
- Foundation: Concrete Perimeter
- Roof: Rubber
Condition
- Year built: 1900
Utilities & green energy
- Electric: Circuit Breakers
- Sewer: Public Sewer
- Water: Public
Community & HOA
Location
- Region: Fitchburg
Financial & listing details
- Price per square foot: $187/sqft
- Tax assessed value: $495,300
- Annual tax amount: $6,583
- Date on market: 9/13/2026
- Total actual rent: 5350
Estimated market value
$584,500
$555,000 - $614,000
$1,869/mo
Price history
| Date | Event | Price |
|---|---|---|
| 9/29/2026 | Price change | $589,900-1.5%$187/sqft |
Source: MLS PIN #73576281 Report a problem | ||
| 9/12/2026 | Listed for sale | $599,000+13%$190/sqft |
Source: MLS PIN #73576281 Report a problem | ||
| 7/7/2025 | Sold | $530,000+6%$168/sqft |
Source: MLS PIN #73347463 Report a problem | ||
| 4/16/2025 | Contingent | $499,900$159/sqft |
Source: MLS PIN #73347463 Report a problem | ||
| 4/7/2025 | Price change | $499,900-4.8%$159/sqft |
Source: MLS PIN #73347463 Report a problem | ||
| 3/19/2025 | Listed for sale | $524,900+6898.7%$167/sqft |
Source: MLS PIN #73347463 Report a problem | ||
| 5/1/2020 | Listing removed | $1,095 |
Source: Lee Bourque Report a problem | ||
| 2/2/2020 | Listed for rent | $1,095+10.1% |
Source: Lee Bourque Report a problem | ||
| 8/2/2019 | Listing removed | $995 |
Source: Lee Bourque Report a problem | ||
| 7/19/2019 | Listed for rent | $995 |
Source: Lee Bourque Report a problem | ||
| 4/4/2019 | Listing removed | $995 |
Source: Lee Bourque Report a problem | ||
| 1/4/2019 | Listed for rent | $995+20.6% |
Source: Lee Bourque Report a problem | ||
| 2/16/2016 | Listing removed | $825 |
Source: Owner Report a problem | ||
| 10/18/2015 | Listed for rent | $825 |
Source: Owner Report a problem | ||
| 10/13/2015 | Sold | $7,500-89.5%$2/sqft |
Source: Public Record Report a problem | ||
| 4/15/1999 | Sold | $71,500+7.5%$23/sqft |
Source: Public Record Report a problem | ||
| 10/13/1998 | Sold | $66,500+269.4%$21/sqft |
Source: Public Record Report a problem | ||
| 3/15/1993 | Sold | $18,000-85.6%$6/sqft |
Source: Public Record Report a problem | ||
| 2/13/1987 | Sold | $125,000$40/sqft |
Source: Public Record Report a problem | ||
Public tax history
| Year | Property taxes | Tax assessment |
|---|---|---|
| 2025 | $5,884 +9.6% | $435,500 +20.1% |
| 2024 | $5,369 +3.4% | $362,500 +11.8% |
| 2023 | $5,194 +12.7% | $324,200 +23.9% |
| 2022 | $4,609 +11.5% | $261,700 +20.4% |
| 2021 | $4,135 +9% | $217,300 +12.9% |
| 2020 | $3,794 +25.9% | $192,500 +30.9% |
| 2019 | $3,014 +10.8% | $147,100 +13.6% |
| 2018 | $2,721 +5.2% | $129,500 +7.6% |
| 2017 | $2,587 -0.1% | $120,400 -1.3% |
| 2016 | $2,590 -3.1% | $122,000 -5.6% |
| 2015 | $2,672 +1.8% | $129,200 -2.4% |
| 2014 | $2,625 +3.5% | $132,400 -0.5% |
| 2013 | $2,536 +10% | $133,100 +1.8% |
| 2012 | $2,305 -9.4% | $130,800 -16.7% |
| 2011 | $2,543 +2% | $157,000 -20% |
| 2009 | $2,492 -3.1% | $196,200 -10.3% |
| 2008 | $2,571 +6.1% | $218,800 +4.2% |
| 2007 | $2,423 +2.9% | $210,000 +7.5% |
| 2006 | $2,355 +5.6% | $195,300 +12.5% |
| 2005 | $2,231 +19.1% | $173,600 +28.1% |
| 2004 | $1,873 +14.1% | $135,500 +30% |
| 2003 | $1,641 +15.8% | $104,200 +31.1% |
| 2001 | $1,417 +7.3% | $79,500 +9.7% |
| 2000 | $1,320 +0.9% | $72,500 -16.4% |
| 1996 | $1,308 | $86,700 |
Find assessor info on the county website
Monthly payment
Est. payment
Payment breakdown
Explore the cost of this home by adjusting the details. Changes won't be saved.Climate risks
Neighborhood: 01420


Similar homes
- $599,9006 bd3 ba3.7k sqft83-85 Marshall St, Fitchburg, MA 01420For Sale
 MLS ID #73587967, Jenka Valdez, View Real Estate Group. MLS PIN
- $574,9996 bd5 ba3.5k sqft114-116 Laurel St, Fitchburg, MA 01420For Sale
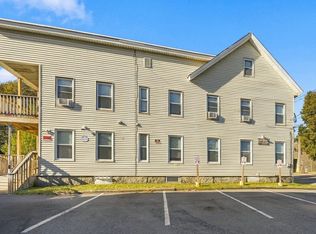 MLS ID #73591013, Candor Investment Group, eXp Realty LLC. MLS PIN
- $550,0007 bd4 ba2.6k sqft151 Mechanic St, Fitchburg, MA 01420For Sale
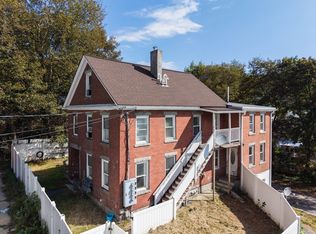 MLS ID #73578883, Derrick Asante, Century 21 XSELL REALTY. MLS PIN
- $619,9006 bd2 ba2.4k sqft55 Elmwood Ave, Fitchburg, MA 01420For Sale
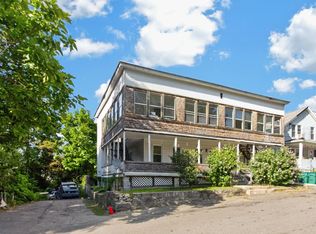 MLS ID #73565842, Traci LaVanway, Coldwell Banker Realty - Leominster. MLS PIN
