INVESTOR SPECIAL, Checkout this 3 bed 1 bath fixer upper located on quiet street. Home has lots of potential. Set your appointment today!
Active
Listed by: Market Pro Realty, Inc • Jared D Childress • 618-977-3705
$36,900
110 N Jefferson St, Medora, IL 62063
3beds
1,300sqft
Single Family Residence
Built in 1910
8,712 Square Feet Lot
$-- Zestimate®
$28/sqft
$-- HOA
What's special
Located on quiet street
- 32 days
- 273
- 9
Zillow last checked:
Listing updated:
Listed by:
Jared D Childress 618-977-3705,
Market Pro Realty, Inc
Source: MARIS,MLS#: 26065631 Originating MLS: Southwestern Illinois Board of REALTORS
Facts & features
Interior
Bedrooms & bathrooms
- Bedrooms: 3
- Bathrooms: 1
- Full bathrooms: 1
- Main level bathrooms: 1
- Main level bedrooms: 2
Heating
- Forced Air
Cooling
- None
Features
- Basement: Partial
- Has fireplace: No
Interior area
- Total structure area: 1,300
- Total interior livable area: 1,300 sqft
- Finished area above ground: 1,300
Property
Features
- Levels: One and One Half
Lot
- Size: 8,712 Square Feet
- Features: City Lot
Details
- Parcel number: 2300091500
- Special conditions: Standard
Construction
Type & style
- Home type: SingleFamily
- Architectural style: Bungalow
- Property subtype: Single Family Residence
Materials
- Frame
Condition
- Year built: 1910
Utilities & green energy
- Electric: Single Phase
- Sewer: Public Sewer, Septic Tank
- Water: Public
Community & HOA
Community
- Subdivision: Rices 2nd Add
HOA
- Has HOA: No
Location
- Region: Medora
Financial & listing details
- Price per square foot: $28/sqft
- Tax assessed value: $33,534
- Annual tax amount: $712
- Date on market: 10/12/2026
- Cumulative days on market: 32 days
- Listing terms: Cash,Conventional
Estimated market value
Not available
Estimated sales range
Not available
Not available
Price history
| Date | Event | Price |
|---|---|---|
| 10/12/2026 | Listed for sale | $36,900$28/sqft |
Source:  MARIS #26065631 Report a problem | ||
Public tax history
| Year | Property taxes | Tax assessment |
|---|---|---|
| 2025 | $712 +2.4% | $11,178 +7% |
| 2024 | $695 +2.5% | $10,447 +8% |
| 2023 | $678 +4.6% | $9,673 +7% |
| 2022 | $648 +0.9% | $9,041 +7% |
| 2021 | $642 +4.5% | $8,450 +7% |
| 2020 | $614 -2.3% | $7,897 |
| 2019 | $629 | $7,897 |
| 2018 | $629 +1.3% | $7,897 |
| 2017 | $621 -2.5% | $7,897 |
| 2016 | $637 -4.8% | $7,897 -2.1% |
| 2015 | $669 | $8,064 |
| 2014 | $669 +8.8% | $8,064 |
| 2013 | $615 +1.1% | $8,064 |
| 2012 | $608 +1.9% | $8,064 |
| 2011 | $596 +0.1% | $8,064 |
| 2010 | $596 | $8,064 |
| 2009 | -- | $8,064 |
Find assessor info on the county website
Monthly payment
Est. payment
Payment breakdown
Explore the cost of this home by adjusting the details. Changes won't be saved.Climate risks
Neighborhood: 62063
Nearby schools
Schools provided by the listing agent
- Elementary: Southwestern Dist 9
- Middle: Southwestern Dist 9
- High: Southwestern
Source: MARIS. This data may not be complete. We recommend contacting the local school district to confirm school assignments for this home.

Similar homes
- $43,0003 bd1 ba990 sqft306 S Maple St, Brighton, IL 62012Active
 MLS ID #12752941, Shannon Long, e-PRO,SFR,SRS, Baird & Warner Fox Valley-Geneva. MRED as distributed by MLS GRID
- $34,9002 bd1 ba1k sqft418 E Elm St, Gillespie, IL 62033For Sale
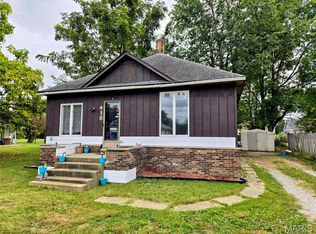
 MLS ID #26061900, Mike Mihelcic, RE/MAX Alliance. MARIS
- $32,5002 bd1 ba936 sqft2201 Johnson St, Alton, IL 62002For Sale
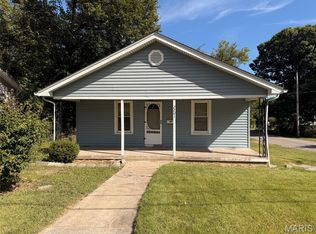 MLS ID #26062888, John A Bolling, Keller Williams Marquee. MARIS
- $44,7003 bd2 ba1.2k sqft2716 W Delmar Ave #52, Godfrey, IL 62035New Construction
 RHP Properties
- $29,9002 bd1 ba825 sqft3112 Trumbull Ave, Alton, IL 62002For SaleMLS ID #26040048, Steven Atkins, Landmark Realty. MARIS
- $50,0003 bd1 ba1.2k sqft1131 Walnut Dr, Cottage Hills, IL 62018AuctionMLS ID #26032332, Jeb E Blasingame, Keller Williams Marquee. MARIS
