Full duplex with a brand-new roof and both units vacant, offering flexibility for an owner-occupant or investor! Located at 1005 East 19th Street in Independence, this property provides the opportunity to live in one side and rent the other or lease both units. Previously rented for $800 & $750 per month, the units generated a combined $1,550 in monthly rent. Both sides are available for immediate showings and ready for your next steps. Qualified buyers may be eligible for a financing program offering zero down payment and reduced private mortgage insurance (PMI), subject to lender approval and program requirements. Explore the possibilities this duplex has to offer!
Active
$175,000
11005 E 19th St S, Independence, MO 64052
--beds
2baths
--sqft
Duplex
Built in 1954
-- sqft lot
$-- Zestimate®
$--/sqft
$-- HOA
What's special
Brand-new roof
- 3 days
- 103
- 8
Likely to sell faster than
Zillow last checked:
Listing updated:
Listed by:
Jeff Yacos 913-638-3530,
Real Broker, LLC
Source: Heartland MLS as distributed by MLS GRID,MLS#: 2646546
Facts & features
Interior
Bedrooms & bathrooms
- Bathrooms: 2
Heating
- Forced Air
Cooling
- None
Appliances
- Included: Refrigerator, Electric Range, Ind Water Heaters
Features
- Windows: Storm Window(s)
- Has basement: No
Property
Parking
- Parking features: Assigned, On Street
- Has uncovered spaces: Yes
Features
- Patio & porch: Porch
- Exterior features: Private Entrance
Lot
- Size: 3,721 Square Feet
Details
- Parcel number: 27610140300000000
- Zoning: x
Construction
Type & style
- Home type: MultiFamily
- Property subtype: Duplex
Materials
- Shingle Siding
- Roof: Composition
Condition
- Year built: 1954
Utilities & green energy
- Sewer: Public Sewer
- Water: Public
- Utilities for property: Ind Heat And Air, Separate Meters
Community & HOA
Community
- Security: Smoke Detector(s)
- Subdivision: Wilhites Englewood Annex
HOA
- Has HOA: No
Location
- Region: Independence
Financial & listing details
- Tax assessed value: $83,310
- Annual tax amount: $1,157
- Date on market: 10/16/2026
- Listing terms: Cash,Conventional
Estimated market value
Not available
Estimated sales range
Not available
Not available
Price history
| Date | Event | Price |
|---|---|---|
| 10/16/2026 | Listed for sale | $175,000+16.7% |
Source:  Heartland MLS as distributed by MLS GRID #2646546 Report a problem | ||
| 5/2/2026 | Listing removed | $800 |
Source: Zillow Rentals Report a problem | ||
| 4/24/2026 | Listed for rent | $800+6.7% |
Source: Zillow Rentals Report a problem | ||
| 2/24/2026 | Listing removed | $750 |
Source: Zillow Rentals Report a problem | ||
| 2/8/2026 | Listed for rent | $750+7.9% |
Source: Zillow Rentals Report a problem | ||
| 5/9/2025 | Sold | -- |
Source: Heartland MLS as distributed by MLS GRID #2539921 Report a problem | ||
| 4/6/2025 | Pending sale | $150,000 |
Source: Heartland MLS as distributed by MLS GRID #2539921 Report a problem | ||
| 4/3/2025 | Listed for sale | $150,000 |
Source: Heartland MLS as distributed by MLS GRID #2539921 Report a problem | ||
| 2/1/2024 | Listing removed | -- |
Source: Zillow Rentals Report a problem | ||
| 1/18/2024 | Price change | $695-0.7% |
Source: Zillow Rentals Report a problem | ||
| 1/11/2024 | Price change | $700-3.4% |
Source: Zillow Rentals Report a problem | ||
| 1/3/2024 | Price change | $725-3.3% |
Source: Zillow Rentals Report a problem | ||
| 12/27/2023 | Price change | $750-3.2% |
Source: Zillow Rentals Report a problem | ||
| 12/14/2023 | Price change | $775-3% |
Source: Zillow Rentals Report a problem | ||
| 10/25/2023 | Listed for rent | $799 |
Source: Zillow Rentals Report a problem | ||
| 9/17/2023 | Listing removed | -- |
Source: Zillow Rentals Report a problem | ||
| 9/16/2023 | Listed for rent | $799 |
Source: Zillow Rentals Report a problem | ||
| 9/16/2023 | Listing removed | -- |
Source: Zillow Rentals Report a problem | ||
| 9/7/2023 | Price change | $799-3.2% |
Source: Zillow Rentals Report a problem | ||
| 8/28/2023 | Price change | $825-2.9% |
Source: Zillow Rentals Report a problem | ||
| 8/11/2023 | Listed for rent | $850+54.5% |
Source: Zillow Rentals Report a problem | ||
| 7/1/2019 | Listing removed | $550 |
Source: Premier Real Estate Management Inc Report a problem | ||
| 6/22/2019 | Listed for rent | $550 |
Source: Premier Real Estate Management Inc Report a problem | ||
Public tax history
| Year | Property taxes | Tax assessment |
|---|---|---|
| 2025 | $1,158 +3.9% | $15,829 +1.3% |
| 2024 | $1,114 +2.5% | $15,632 |
| 2023 | $1,087 +19.2% | $15,632 +30.6% |
| 2022 | $912 -24.1% | $11,970 |
| 2021 | $1,201 +47.8% | $11,970 +14.8% |
| 2020 | $813 +1.5% | $10,428 |
| 2019 | $801 | $10,428 +14.9% |
| 2018 | $801 +8% | $9,076 |
| 2017 | $741 +3.8% | $9,076 +2.6% |
| 2016 | $715 +1.8% | $8,848 |
| 2014 | $702 +0.6% | $8,848 |
| 2013 | $698 +1.2% | $8,848 |
| 2012 | $690 +1.7% | $8,848 |
| 2011 | $678 +2.4% | $8,848 |
| 2010 | $662 -7.5% | $8,848 |
| 2009 | $716 +2.5% | $8,848 -11% |
| 2008 | $698 -0.6% | $9,942 |
| 2007 | $703 +0% | $9,942 |
| 2006 | $703 +13.4% | $9,942 |
| 2005 | $619 +0% | $9,942 +15% |
| 2004 | $619 +12.4% | $8,645 |
| 2003 | $551 +0% | $8,645 +13.8% |
| 2002 | $550 +0.1% | $7,600 |
| 2001 | $550 | $7,600 |
Find assessor info on the county website
Monthly payment
Est. payment
Payment breakdown
Explore the cost of this home by adjusting the details. Changes won't be saved.Climate risks
Neighborhood: Bristol

Similar homes
- $195,0002 bd1 ba840 sqft10601 E Sheley Rd, Independence, MO 64052For Sale
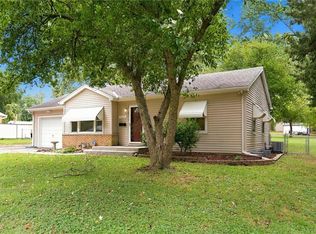 MLS ID #2647654, Harry Meierarend IV, RE/MAX Premier Properties. Heartland MLS as distributed by MLS GRID
- $--2 bd1 ba1.5k sqft2122 S Scott Ave, Independence, MO 64052Auction
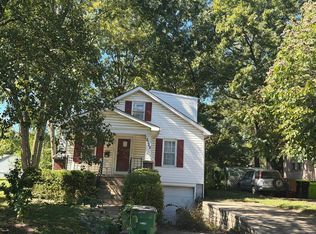 Auction.com 2
- $160,0003 bd1 ba864 sqft2901 Appleton Ave, Independence, MO 64052For Sale
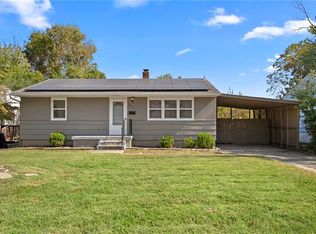 MLS ID #2647439, Nic Trotter, 1st Class Real Estate Summit. Heartland MLS as distributed by MLS GRID
- $205,0003 bd2 ba1.2k sqft3016 S Norwood Ave, Independence, MO 64052For Sale
 MLS ID #2647487, Danna Brown, Realty Executives. Heartland MLS as distributed by MLS GRID
