Exceptional single-story home near SoFi Stadium! Welcome to 1101 W 110th St, a spacious 5-bed, 3-bath residence with nearly 2,000 sq ft on a generous lot. A legal, well-executed garage conversion creates a versatile second unit, perfect for investors generating strong short-term rental income or families who want flexible living space. The front unit's open floor plan showcases warm laminate wood-look flooring that flows from the bright living area into an updated kitchen with crisp white cabinetry. Enjoy the inviting covered front porch and well-maintained exterior with fresh gray siding and white trim. Just minutes from SoFi Stadium, the Intuit Dome, freeways, shopping, and downtown LA. An outstanding opportunity in a high-demand South LA neighborhood.
For sale
Price increase: $10K (10/19)
$885,000
1101 W 110th St, Los Angeles, CA 90044
5beds
1,844sqft
Residential
Built in 1912
7,744 Square Feet Lot
$890,600 Zestimate®
$480/sqft
$-- HOA
What's special
- 4 days
- 112
- 9
Zillow last checked:
Listing updated:
Listed by:
Brandon Hauer DRE # 01741530 323-445-8547,
Brandon Hauer Real Estate Group 323-445-8547
Source: CLAW,MLS#: 26102848
Facts & features
Interior
Bedrooms & bathrooms
- Bedrooms: 5
- Bathrooms: 3
- Full bathrooms: 3
Rooms
- Room types: Other
Heating
- Other
Cooling
- Other
Appliances
- Laundry: Other
Features
- Flooring: Other
- Has fireplace: Yes
- Fireplace features: Other
Interior area
- Total structure area: 1,844
- Total interior livable area: 1,844 sqft
Property
Parking
- Parking features: Other
Features
- Levels: One
- Pool features: Other
- Spa features: Other
- Has view: Yes
- View description: Other
Lot
- Size: 7,744 Square Feet
- Dimensions: 60 x 129
Details
- Additional structures: Other
- Parcel number: 6076011024
- Zoning: LCR320U*
- Special conditions: Standard
- Other equipment: Other
Construction
Type & style
- Home type: SingleFamily
- Architectural style: Other
- Property subtype: Residential
Condition
- Year built: 1912
Community & HOA
HOA
- Has HOA: No
Location
- Region: Los Angeles
Financial & listing details
- Price per square foot: $480/sqft
- Tax assessed value: $778,372
- Date on market: 10/16/2026
Estimated market value
$890,600
$846,000 - $935,000
$4,273/mo
Price history
| Date | Event | Price |
|---|---|---|
| 10/19/2026 | Price change | $885,000+1.1%$480/sqft |
Source:  CLAW #26102848 Report a problem | ||
| 10/16/2026 | Listed for sale | $875,000+24.1%$475/sqft |
Source: CLAW #26102848 Report a problem | ||
| 5/4/2021 | Sold | $705,000-9%$382/sqft |
Source: Public Record Report a problem | ||
| 1/15/2021 | Listing removed | -- |
Source: CRISNet / SRAR Report a problem | ||
| 11/18/2020 | Listed for sale | $775,000+24%$420/sqft |
Source: Century 21 Peak #SR20236613 Report a problem | ||
| 4/20/2020 | Sold | $625,000-6%$339/sqft |
Source:  Pasadena Foothills MLS #819005529 Report a problem | ||
| 2/20/2020 | Pending sale | $665,000$361/sqft |
Source: Evernest Real Estate Advisors #819005529 Report a problem | ||
| 12/18/2019 | Listed for sale | $665,000+75%$361/sqft |
Source: Evernest Real Estate Advisors #819005529 Report a problem | ||
| 8/9/2019 | Sold | $380,000-8.4%$206/sqft |
Source: Public Record Report a problem | ||
| 7/25/2019 | Listed for sale | $415,000+72.9%$225/sqft |
Source: PlatinumRealty.LA #819003475 Report a problem | ||
| 2/18/2016 | Sold | $240,000-5.9%$130/sqft |
Source: Public Record Report a problem | ||
| 10/6/2014 | Listing removed | $255,000$138/sqft |
Source: Owner Report a problem | ||
| 9/24/2014 | Listed for sale | $255,000+104%$138/sqft |
Source: Owner Report a problem | ||
| 12/30/2011 | Sold | $125,000$68/sqft |
Source: Public Record Report a problem | ||
Public tax history
| Year | Property taxes | Tax assessment |
|---|---|---|
| 2026 | -- | $778,372 +2% |
| 2025 | $10,028 +3.1% | $763,111 +2% |
| 2024 | $9,724 +2.2% | $748,149 +2% |
| 2023 | $9,519 +5% | $733,481 +2% |
| 2022 | $9,065 +1.8% | $719,100 +13.9% |
| 2021 | $8,907 +9.7% | $631,475 +66.2% |
| 2020 | $8,116 +53.6% | $380,000 +49.2% |
| 2019 | $5,284 +47.8% | $254,688 +2% |
| 2018 | $3,575 | $249,695 +2% |
| 2017 | $3,575 +1.9% | $244,800 +84.6% |
| 2016 | $3,509 +62% | $132,627 +1.5% |
| 2015 | $2,166 +1.2% | $130,636 +2% |
| 2014 | $2,141 | $128,078 +2.5% |
| 2012 | -- | $125,000 -47% |
| 2011 | -- | $235,761 +339.4% |
| 2010 | -- | $53,654 -0.2% |
| 2009 | -- | $53,782 +2% |
| 2008 | -- | $52,729 +2% |
| 2007 | -- | $51,696 +2% |
| 2006 | -- | $50,683 |
| 2005 | -- | $50,683 +4% |
| 2004 | -- | $48,718 +1.9% |
| 2003 | -- | $47,826 +2% |
| 2002 | -- | $46,889 +4% |
| 2000 | -- | $45,070 |
Find assessor info on the county website
Monthly payment
Est. payment
Payment breakdown
Explore the cost of this home by adjusting the details. Changes won't be saved.Climate risks
Neighborhood: 90044

Similar homes
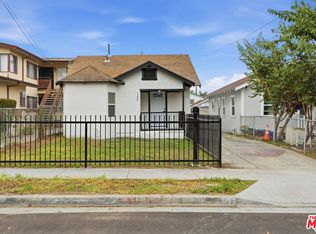
- $799,1004 bd3 ba1.3k sqft528 W 99th St, Los Angeles, CA 90044For Sale
 MLS ID #26947183, Masha Krakovskaya DRE # 01797676, Christie's International Real Estate SoCal. CLAW
- $899,0003 bd3 ba2.1k sqft14919 Burin Ave, Lawndale, CA 90260For Sale
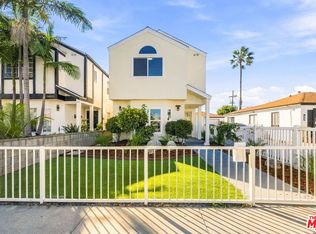 MLS ID #26102844, Brian Nakagiri DRE # 01817767, PCRE. CLAW
- $899,0004 bd2 ba1.8k sqft10829 Firmona Ave, Lennox, CA 90304For Sale
 MLS ID #RS26218189, Maria Reyes, Amberwood Real Estate. CRMLS
- $649,9003 bd3 ba1.2k sqft1232 W 74th St, Los Angeles, CA 90044For Sale
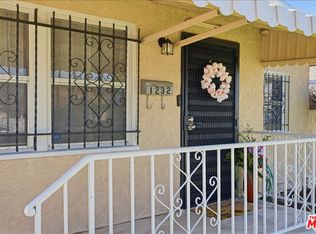 MLS ID #26994969, Yolanda Caldwell DRE # 01760050, Sotheby's International Realty. CLAW
