Charming starter or downsizing home in wonderful Piedmont location! Almost all features have been updated within last 5 years including kitchen and bath. Second bedroom is non-conforming in attic. Basement has tall ceilings and offers plenty of storage space.Private back yard with easy maintenance turf and large deck. [Home Energy Score = 2. HES Report at https://rpt.greenbuildingregistry.com/hes/OR10036705]
Pre-foreclosure
Est. $459,630
1102 N Winchell St, Portland, OR 97217
1beds
1,502sqft
SingleFamily
Built in 1910
2,613 Square Feet Lot
$-- Zestimate®
$306/sqft
$-- HOA
Overview
- 51 days
- 16
- 0
Facts & features
Interior
Bedrooms & bathrooms
- Bedrooms: 1
- Bathrooms: 1
- Full bathrooms: 1
- Main level bathrooms: 1
Heating
- Forced air, Gas
Appliances
- Included: Dishwasher, Range / Oven, Refrigerator
Features
- Ceiling Fan(s), Dishwasher, Laminate Flooring, Laundry, Free-Standing Range, Free-Standing Refrigerator
- Flooring: Laminate
- Basement: Unfinished
Interior area
- Total interior livable area: 1,502 sqft
Property
Parking
- Parking features: Garage
Features
- Patio & porch: Deck
- Exterior features: Shingle (Not Wood)
- Fencing: Fenced
Lot
- Size: 2,613 Square Feet
- Features: Level
Details
- Parcel number: R160001
Construction
Type & style
- Home type: SingleFamily
- Architectural style: Bungalow
Materials
- Roof: Composition
Condition
- Year built: 1910
- Major remodel year: 1910
Utilities & green energy
- Sewer: Public Sewer
- Water: Public
Green energy
- Green verification: Home Energy Score
Community & HOA
Location
- Region: Portland
Financial & listing details
- Price per square foot: $306/sqft
- Tax assessed value: $459,630
- Annual tax amount: $2,920
Foreclosure details
Estimated market value
Not available
Estimated sales range
Not available
$1,545/mo
Price history
| Date | Event | Price |
|---|---|---|
| 2/27/2020 | Sold | $333,900$222/sqft |
Source:  RMLS (OR) #19116691 Report a problem | ||
| 12/17/2019 | Pending sale | $333,900$222/sqft |
Source: Oregon Realty Co. #19116691 Report a problem | ||
| 12/12/2019 | Listed for sale | $333,900+27%$222/sqft |
Source: Oregon Realty Co. #19116691 Report a problem | ||
| 6/22/2015 | Sold | $263,000+1.2%$175/sqft |
Source: RMLS (OR) #15505585 Report a problem | ||
| 5/23/2015 | Pending sale | $259,900$173/sqft |
Source: Living Room Realty #15505585 Report a problem | ||
| 5/8/2015 | Listed for sale | $259,900+30%$173/sqft |
Source: Living Room Realty #15505585 Report a problem | ||
| 6/18/2008 | Sold | $199,900$133/sqft |
Source: Public Record Report a problem | ||
| 4/25/2008 | Price change | $199,900-9.1%$133/sqft |
Source: Number1Expert #8039303 Report a problem | ||
| 4/5/2008 | Listed for sale | $219,900+7.3%$146/sqft |
Source: Number1Expert #8039303 Report a problem | ||
| 3/21/2007 | Sold | $205,000+32.3%$136/sqft |
Source: Public Record Report a problem | ||
| 8/26/2005 | Sold | $155,000+158.3%$103/sqft |
Source: Public Record Report a problem | ||
| 1/18/2002 | Sold | $60,000$40/sqft |
Source: Public Record Report a problem | ||
| 10/16/1998 | Sold | $60,000$40/sqft |
Source: Public Record Report a problem | ||
Public tax history
| Year | Property taxes | Tax assessment |
|---|---|---|
| 2025 | $2,920 +3.7% | $108,360 +3% |
| 2024 | $2,815 +4% | $105,210 +3% |
| 2023 | $2,707 +2.2% | $102,150 +3% |
| 2022 | $2,648 +1.7% | $99,180 +3% |
| 2021 | $2,604 +9% | $96,300 +3% |
| 2020 | $2,389 +3.8% | $93,500 +3% |
| 2019 | $2,301 | $90,780 +3% |
| 2018 | $2,301 +3% | $88,140 +3% |
| 2017 | $2,233 +14% | $85,580 +3% |
| 2016 | $1,959 | $83,090 +3% |
| 2015 | $1,959 +2.7% | $80,670 +3% |
| 2014 | $1,908 +3.9% | $78,330 +3% |
| 2013 | $1,835 +10.5% | $76,050 +3% |
| 2012 | $1,660 +3.9% | $73,840 +3% |
| 2011 | $1,598 +5.4% | $71,690 +3% |
| 2010 | $1,516 +2.7% | $69,610 +3% |
| 2009 | $1,477 +6% | $67,590 +3% |
| 2008 | $1,394 +0.3% | $65,630 +3% |
| 2007 | $1,389 -16.6% | $63,720 -22.8% |
| 2006 | $1,665 +32.2% | $82,560 +30.1% |
| 2005 | $1,259 -8.2% | $63,460 +3% |
| 2004 | $1,372 +2.3% | $61,620 +3% |
| 2003 | $1,341 +8.9% | $59,830 +3% |
| 2002 | $1,232 +7.4% | $58,090 +6.1% |
| 2000 | $1,147 | $54,760 |
Find assessor info on the county website
Monthly payment
Climate risks
Neighborhood: Piedmont
Nearby schools
Schools provided by the listing agent
- Elementary: Chief Joseph
- Middle: Ockley Green
- High: Jefferson
Source: The MLS. This data may not be complete. We recommend contacting the local school district to confirm school assignments for this home.


Similar homes
- $--2 bd1 ba906 sqft6364 N Moore Ave, Portland, OR 97217Auction
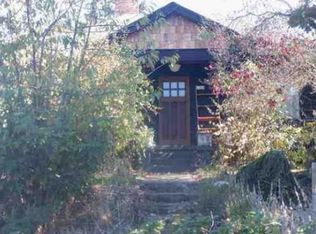 Xome
- $--3 bd2 ba1.3k sqft5850 NE 18th Ave, Portland, OR 97211Auction
 Auction.com 2
- $365,0003 bd3 ba1.4k sqft2723 N Houghton St, Portland, OR 97217Active
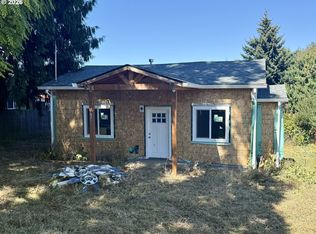
 MLS ID #671352209, Brad Hammond, Keller Williams PDX Central. RMLS (OR)
- $595,0002 bd2 ba1.1k sqft6923 N Williams Ave, Portland, OR 97217Active
 MLS ID #550638671, Carlos Gonzalez, TreeHouse Realty. RMLS (OR)
- $460,0003 bd1 ba1.4k sqft8124 SE Ash St, Portland, OR 97215ActiveMLS ID #542726751, Chris Suarez, Keller Williams Sunset Corridor. RMLS (OR)
- $560,0004 bd3 ba1.5k sqft5390 NE Skidmore St, Portland, OR 97218ActiveMLS ID #485564577, Emily Hetrick, Keller Williams PDX Central. RMLS (OR)
- $365,7502 bd1 ba1k sqft1411 NE Skidmore St, Portland, OR 97211ActiveMLS ID #543811618, Chris Anderson, John L. Scott Sandy. RMLS (OR)
- $510,0004 bd2 ba1.7k sqft9535 N Charleston Ave, Portland, OR 97203For Sale
 MLS ID #220226764, Liz Puffenbarger, Roots Real Estate Collective LLC.. Oregon Datashare
