This income-producing 2-bedroom, 1-bath renovated home is located in the heart of downtown New Albany, just minutes from the area’s eclectic shops, restaurants, and local coffee shops.
The property features recent updates from 2021, including a renovated bathroom, updated kitchen, and new flooring, making it an attractive and low-maintenance option for investors or homeowners alike.
Currently generating rent on a month-to-month lease, this home presents a great opportunity for investors seeking a buy and hold, or buyers looking for a centrally located property with income potential. 24 HOUR NOTICE TO SHOW IS REQUIRED.
For sale
$149,900
1113 Culbertson Avenue, New Albany, IN 47150
2beds
1,024sqft
Single Family Residence
Built in 1929
2,962 Square Feet Lot
$145,200 Zestimate®
$146/sqft
$-- HOA
What's special
Updated kitchenNew flooringRenovated bathroom
- 6 days
- 296
- 29
Likely to sell faster than
Zillow last checked:
Listing updated:
Listed by:
Cameo Bennett,
Six Degrees Real Estate LLC
Source: SIRA,MLS#: 2026012625 Originating MLS: Southern Indiana REALTORS Association
Facts & features
Interior
Bedrooms & bathrooms
- Bedrooms: 2
- Bathrooms: 1
- Full bathrooms: 1
Heating
- Forced Air
Cooling
- Central Air
Appliances
- Included: Dryer, Microwave, Oven, Range, Refrigerator, Washer
Features
- Eat-in Kitchen, Mud Room, Utility Room
- Has basement: No
- Number of fireplaces: 1
- Fireplace features: Decorative
Interior area
- Total structure area: 1,024
- Total interior livable area: 1,024 sqft
- Finished area above ground: 1,024
- Finished area below ground: 0
Property
Parking
- Parking features: Off Street
Lot
- Size: 2,962 Square Feet
Details
- Parcel number: 220502800188000
Construction
Type & style
- Home type: SingleFamily
- Property subtype: Single Family Residence
Materials
- Vinyl Siding, Frame
- Foundation: Block, Cellar
- Roof: Shingle
Condition
- New construction: No
- Year built: 1929
Utilities & green energy
- Water: Connected, Public
Community & HOA
Location
- Region: New Albany
Financial & listing details
- Price per square foot: $146/sqft
- Tax assessed value: $62,300
- Annual tax amount: $1,176
- Date on market: 10/18/2026
- Listing terms: Cash,Conventional,FHA,VA Loan
Estimated market value
$145,200
$136,000 - $152,000
$1,257/mo
Price history
| Date | Event | Price |
|---|---|---|
| 10/18/2026 | Listed for sale | $149,900-5.7%$146/sqft |
Source:  SIRA #2026012625 Report a problem | ||
| 9/7/2026 | Listing removed | $159,000$155/sqft |
Source: SIRA #202606497 Report a problem | ||
| 6/24/2026 | Price change | $159,000-3.6%$155/sqft |
Source: SIRA #202606497 Report a problem | ||
| 3/7/2026 | Listed for sale | $165,000+243.8%$161/sqft |
Source: SIRA #202606497 Report a problem | ||
| 4/28/2021 | Listing removed | -- |
Source: Zillow Rental Manager Report a problem | ||
| 4/13/2021 | Listed for rent | $1,200$1/sqft |
Source: Zillow Rental Manager Report a problem | ||
| 2/25/2021 | Listing removed | -- |
Source: Zillow Rental Manager Report a problem | ||
| 1/25/2021 | Listed for rent | $1,200$1/sqft |
Source: Zillow Rental Manager Report a problem | ||
| 7/15/2020 | Sold | $48,000$47/sqft |
Source: Public Record Report a problem | ||
Public tax history
| Year | Property taxes | Tax assessment |
|---|---|---|
| 2025 | $1,176 +17.8% | $62,300 +12.5% |
| 2024 | $999 -2.8% | $55,400 +18.4% |
| 2023 | $1,028 +12.9% | $46,800 -2.9% |
| 2022 | $910 +2.2% | $48,200 +13.9% |
| 2021 | $890 +5.3% | $42,300 +2.4% |
| 2020 | $846 +6.2% | $41,300 +5.4% |
| 2019 | $797 -1.5% | $39,200 +6.8% |
| 2018 | $808 | $36,700 +0.3% |
| 2017 | $808 +19.9% | $36,600 +0.8% |
| 2016 | $674 | $36,300 -30.6% |
| 2014 | $674 -35.6% | $52,300 -3% |
| 2013 | $1,046 -4% | $53,900 -1.1% |
| 2012 | $1,090 +17.5% | $54,500 +17.5% |
| 2011 | $928 +36.9% | $46,400 +36.9% |
| 2010 | $678 +5.3% | $33,900 +5.3% |
| 2009 | $644 +307% | $32,200 +1.9% |
| 2007 | $158 | $31,600 -6.2% |
| 2006 | -- | $33,700 +36.4% |
| 2005 | -- | $24,700 |
Find assessor info on the county website
Monthly payment
Est. payment
Payment breakdown
Explore the cost of this home by adjusting the details. Changes won't be saved.Climate risks
Neighborhood: Midtown


Similar homes
- $144,9002 bd1 ba1.2k sqft1804 E Spring Street, New Albany, IN 47150For Sale
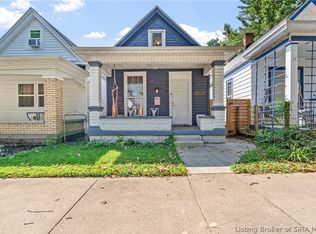 MLS ID #202609847, Zachary Robbins, eXp Realty, LLC. SIRA
- $149,9001 bd1 ba572 sqft2404 Fairmont Avenue, New Albany, IN 47150For Sale
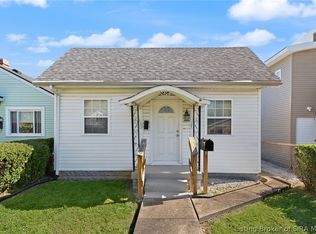 MLS ID #2026012768, Janna Schickel, Lopp Real Estate Brokers. SIRA
- $169,5002 bd2 ba1k sqft1306 Ekin Avenue, New Albany, IN 47150For Sale
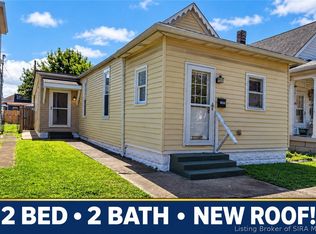 MLS ID #2026012120, Heather L Allen, Genesis Realty LLC. SIRA
- $150,0002 bd1 ba924 sqft71 E 18th Street, New Albany, IN 47150For Sale
 MLS ID #2026011704, Samantha Hernandez, GreenTree Real Estate Services. SIRA
