Coastal investment opportunity just blocks from the beach in Oceanside. This four-unit multifamily property features two bedrooms, two bathrooms, and a private attached one-car garage in each unit. With a desirable beach-close location and the convenience of individual garages, this property is an appealing opportunity for investors seeking a coastal addition to their portfolio.
For sale
Listed by: The CREM Group • Mark Cianciulli • Contact: 323-208-9512
$1,795,000
1144 S Nevada St, Oceanside, CA 92054
8beds
8baths
3,151sqft
Quadruplex
Built in 1990
-- sqft lot
$1,736,300 Zestimate®
$570/sqft
$-- HOA
What's special
- 3 days
- 417
- 46
Zillow last checked:
Listing updated:
Listed by:
Mark Cianciulli DRE #01990266 323-208-9512,
The CREM Group
Source: CRMLS,MLS#: PW26227722 Originating MLS: California Regional MLS
Facts & features
Interior
Bedrooms & bathrooms
- Bedrooms: 8
- Bathrooms: 8
Appliances
- Laundry: Inside
Features
- Has fireplace: No
- Fireplace features: None
- Common walls with other units/homes: 1 Common Wall
Interior area
- Total structure area: 3,151
- Total interior livable area: 3,151 sqft
Property
Parking
- Total spaces: 4
- Parking features: Garage
- Garage spaces: 4
Features
- Levels: Two
- Stories: 2
- Entry location: 2
- Pool features: None
Lot
- Size: 10,150 Square Feet
- Features: Corner Lot
Details
- Parcel number: 1521212300
- Special conditions: Probate Listing
Construction
Type & style
- Home type: MultiFamily
- Property subtype: Quadruplex
- Attached to another structure: Yes
Condition
- New construction: No
- Year built: 1990
Utilities & green energy
- Sewer: Public Sewer
- Water: Public
Community & HOA
Community
- Features: Sidewalks
- Subdivision: Oceanside
Location
- Region: Oceanside
Financial & listing details
- Price per square foot: $570/sqft
- Tax assessed value: $542,548
- Date on market: 10/21/2026
- Cumulative days on market: 3 days
- Listing terms: Submit
Estimated market value
$1,736,300
$1.65M - $1.82M
$4,845/mo
Price history
| Date | Event | Price |
|---|---|---|
| 10/22/2026 | Listed for sale | $1,795,000+435.8%$570/sqft |
Source:  CRMLS #PW26227722 Report a problem | ||
| 5/5/1999 | Sold | $335,000+1075.4%$106/sqft |
Source: Public Record Report a problem | ||
| 3/13/1995 | Sold | $28,500$9/sqft |
Source: Public Record Report a problem | ||
Public tax history
| Year | Property taxes | Tax assessment |
|---|---|---|
| 2026 | -- | $542,548 +2% |
| 2025 | $6,045 +2% | $531,911 +2% |
| 2024 | $5,929 +3.2% | $521,482 +2% |
| 2023 | $5,746 +1.5% | $511,257 +2% |
| 2022 | $5,659 -0.4% | $501,234 +2% |
| 2021 | $5,681 +3.2% | $491,407 +1% |
| 2020 | $5,507 +4.8% | $486,369 +2% |
| 2019 | $5,256 -0.7% | $476,834 +2% |
| 2018 | $5,292 +1.9% | $467,486 +2% |
| 2017 | $5,195 +3.4% | $458,320 +2% |
| 2016 | $5,026 +3% | $449,334 +1.5% |
| 2015 | $4,881 +4% | $442,586 +2% |
| 2014 | $4,695 | $433,917 +0.5% |
| 2013 | -- | $431,957 +2% |
| 2012 | -- | $423,488 +2% |
| 2011 | -- | $415,186 +0.8% |
| 2010 | -- | $412,084 -0.2% |
| 2009 | -- | $413,064 +2% |
| 2008 | -- | $404,966 +2% |
| 2007 | -- | $397,026 +2.8% |
| 2006 | -- | $386,301 +2.5% |
| 2005 | -- | $376,767 +2% |
| 2004 | -- | $369,380 +1.9% |
| 2003 | -- | $362,611 +2% |
| 2002 | -- | $355,501 +2% |
| 2001 | -- | $348,532 |
Find assessor info on the county website
Monthly payment
Est. payment
Payment breakdown
Explore the cost of this home by adjusting the details. Changes won't be saved.Climate risks
Neighborhood: Townsite

Similar homes
- $2,149,0005 bd3 ba3.4k sqft2399 Ivy Rd, Oceanside, CA 92054For Sale
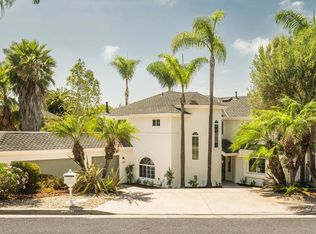 MLS ID #NDP2607441, Mitch Smith, Compass. CRMLS
- $1,851,9005 bd4 ba3.2k sqft2318 Loker Way, Oceanside, CA 92054New Construction
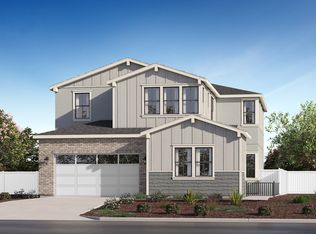 Lennar Homes
- $2,195,0009 bd6 ba3.5k sqft426 Grant St, Oceanside, CA 92054For Sale
 MLS ID #OC26067801, Joey Leisz, Inhabit Collective. CRMLS
- from $1,799,9005 bd4 ba3.2k sqftSignal Point 2 Plan, Signal Point, Oceanside, CA 92054New ConstructionLennar Homes
