Stop by and take a look at this move-in ready home that has been updated with a model kitchen and bath. Property also features an Accessory Dwelling Unit (ADU) for rental income or family that has also been updated. This property is a great opportunity for flexible living and strong rental potential.
Active
$589,950
115 Hollywood Ave, Tracy, CA 95376
3beds
1,889sqft
Single Family Residence
Built in 1944
7,801 Square Feet Lot
$582,800 Zestimate®
$312/sqft
$-- HOA
What's special
Move-in ready home
- 24 days
- 1,014
- 51
Likely to sell faster than
Zillow last checked:
Listing updated:
Listed by:
Armando Magana DRE #01376533 209-614-6232,
Castle Real Estate
Source: MetroList Services of CA,MLS#: 226120850Originating MLS: MetroList Services, Inc.
Facts & features
Interior
Bedrooms & bathrooms
- Bedrooms: 3
- Bathrooms: 2
- Full bathrooms: 2
Dining room
- Features: Formal Area
Kitchen
- Features: Other Counter
Heating
- Central
Cooling
- Ceiling Fan(s), Central Air
Appliances
- Included: Dishwasher, Free-Standing Electric Range
- Laundry: In Garage
Features
- Flooring: Laminate
- Has fireplace: No
Interior area
- Total interior livable area: 1,889 sqft
Property
Parking
- Total spaces: 1
- Parking features: Detached
- Garage spaces: 1
Features
- Fencing: Back Yard
Lot
- Size: 7,801 Square Feet
- Features: Irregular Lot
Details
- Parcel number: 233340070000
- Zoning: Res
- Special conditions: Standard
Construction
Type & style
- Home type: SingleFamily
- Property subtype: Single Family Residence
Materials
- Brick, Stucco, Frame
- Foundation: Raised
- Roof: Composition
Condition
- Year built: 1944
Utilities & green energy
- Electric: Other
- Sewer: Other
- Water: Public
- Utilities for property: Public
Community & HOA
Location
- Region: Tracy
Financial & listing details
- Price per square foot: $312/sqft
- Tax assessed value: $154,061
- Price range: $590K - $590K
- Date on market: 9/27/2026
Estimated market value
$582,800
$554,000 - $612,000
$2,625/mo
Price history
| Date | Event | Price |
|---|---|---|
| 9/27/2026 | Listed for sale | $589,950-1.3%$312/sqft |
Source: MetroList Services of CA #226120850 Report a problem | ||
| 9/25/2026 | Listing removed | $598,000$317/sqft |
Source: MetroList Services of CA #226100280 Report a problem | ||
| 9/7/2026 | Listed for sale | $598,000$317/sqft |
Source: MetroList Services of CA #226100280 Report a problem | ||
| 8/16/2026 | Pending sale | $598,000$317/sqft |
Source: MetroList Services of CA #226100280 Report a problem | ||
| 8/10/2026 | Listed for sale | $598,000+34.4%$317/sqft |
Source: MetroList Services of CA #226100280 Report a problem | ||
| 5/28/2026 | Sold | $445,000+270.8%$236/sqft |
Source: Public Record Report a problem | ||
| 2/9/2021 | Listing removed | -- |
Source: Owner Report a problem | ||
| 1/22/2018 | Listing removed | $1,900$1/sqft |
Source: Owner Report a problem | ||
| 1/12/2018 | Listed for rent | $1,900-2.6%$1/sqft |
Source: Owner Report a problem | ||
| 11/9/2017 | Listing removed | $1,950$1/sqft |
Source: Owner Report a problem | ||
| 11/3/2017 | Listed for rent | $1,950$1/sqft |
Source: Owner Report a problem | ||
| 11/16/2010 | Sold | $120,000+0.1%$64/sqft |
Source: Public Record Report a problem | ||
| 9/10/2010 | Pending sale | $119,900$63/sqft |
Source: Fannie Mae #10060589 Report a problem | ||
| 9/9/2010 | Price change | $119,900-19.8%$63/sqft |
Source: Fannie Mae #10060589 Report a problem | ||
| 7/31/2010 | Listed for sale | $149,500-43%$79/sqft |
Source: foreclosure.com Report a problem | ||
| 6/23/2010 | Sold | $262,336-16.7%$139/sqft |
Source: Public Record Report a problem | ||
| 3/26/2004 | Sold | $315,000$167/sqft |
Source: Public Record Report a problem | ||
Public tax history
| Year | Property taxes | Tax assessment |
|---|---|---|
| 2026 | -- | $154,061 +2% |
| 2025 | $1,755 +8.5% | $151,041 +2% |
| 2024 | $1,617 +1.6% | $148,080 +2% |
| 2023 | $1,592 +2.1% | $145,177 +2% |
| 2022 | $1,560 +1.2% | $142,331 +2% |
| 2021 | $1,542 +0.6% | $139,541 +1% |
| 2020 | $1,532 +1.6% | $138,112 +2% |
| 2019 | $1,508 +1.7% | $135,405 +2% |
| 2018 | $1,483 +5.2% | $132,751 +2% |
| 2017 | $1,409 -1.2% | $130,149 +2% |
| 2016 | $1,426 +0.9% | $127,597 +1.5% |
| 2015 | $1,413 +6% | $125,681 +2% |
| 2014 | $1,333 | $123,219 +0.5% |
| 2013 | -- | $122,664 +2% |
| 2012 | -- | $120,258 +2% |
| 2011 | -- | $117,900 -37.9% |
| 2010 | -- | $190,000 -13.6% |
| 2009 | -- | $220,000 -35.5% |
| 2008 | -- | $340,962 +2% |
| 2007 | -- | $334,278 +2% |
| 2006 | -- | $327,726 +2% |
| 2005 | -- | $321,300 +426.4% |
| 2004 | -- | $61,038 +1.9% |
| 2003 | -- | $59,919 +4% |
| 2002 | -- | $57,593 |
| 2001 | -- | $57,593 |
Find assessor info on the county website
Monthly payment
Est. payment
Payment breakdown
Explore the cost of this home by adjusting the details. Changes won't be saved.Climate risks
Neighborhood: 95376


Similar homes
- $599,9993 bd3 ba1.8k sqft132 Henry Ct, Tracy, CA 95376For Sale
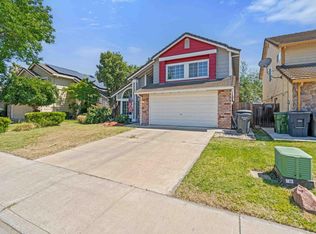 MLS ID #226129669, Randy Thomas. MetroList Services of CA
- $579,0003 bd2 ba1.6k sqft1250 Coolidge Ave, Tracy, CA 95376For Sale
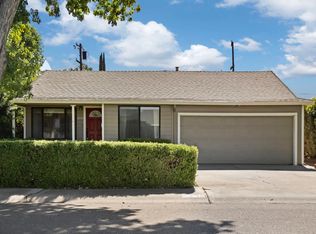 MLS ID #226094872, Kim Cose. MetroList Services of CA
- $495,0003 bd2 ba1.3k sqft2828 Cabrillo Dr, Tracy, CA 95376For Sale
 MLS ID #226128995, Tara Wagner. MetroList Services of CA
- $590,0003 bd2 ba1.4k sqft1890 Ashland Dr, Tracy, CA 95376For Sale
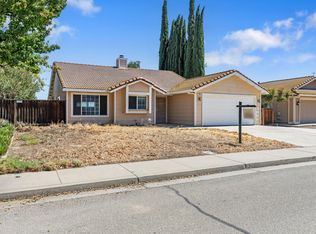 MLS ID #226112200, Jeff Purcell. MetroList Services of CA
