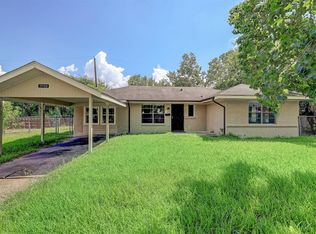
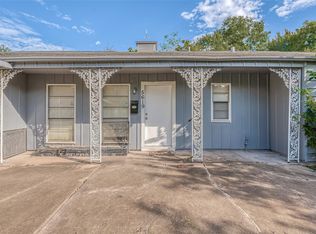
The home is tenant occupied and perfect for an investor looking for tenant-occupied properties.
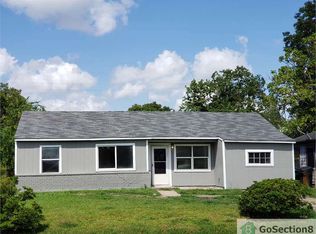
Located in the rapidly evolving 77047 area, 11615 Duane St offers an incredible opportunity in one of Houston’s fastest-growing pockets. Just minutes from major thoroughfares including State Highway 288, Beltway 8, and the South Loop (I-610), this location provides quick and convenient access to Downtown Houston, the Texas Medical Center, and Pearland. The surrounding area is experiencing significant growth and revitalization, making it a prime choice for buyers looking to get in early. Whether you’re a first-time homebuyer searching for value or an investor looking to capitalize on continued development and appreciation, this property is a smart move in a high-potential location.
For sale
$189,000
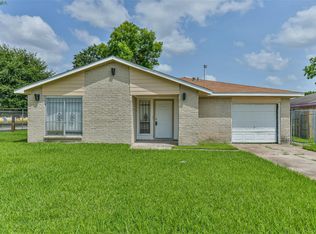
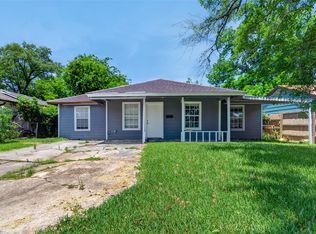
11615 Duane St, Houston, TX 77047
4beds
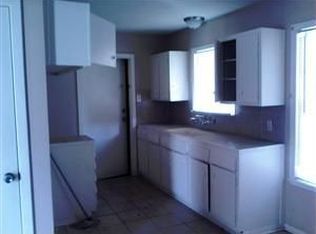
1,217sqft
Single Family Residence
Built in 1956
6,599 Square Feet Lot
$181,200 Zestimate®
$155/sqft
$-- HOA
What's special
- 2 days |
- 21 |
- 2 |
Likely to sell faster than
Zillow last checked:
Listing updated:
Listed by:
Brook Wilson TREC #0705205 346-714-8666,
FYI Realty - Katy
Source: HAR,MLS#: 79244209
Loading...
Facts & features
Interior
Bedrooms & bathrooms
- Bedrooms: 4
- Bathrooms: 2
- Full bathrooms: 2
Heating
- Electric, Natural Gas
Cooling
- Electric, Gas
Interior area
- Total structure area: 1,217
- Total interior livable area: 1,217 sqft
Property
Features
- Stories: 1
Lot
- Size: 6,599 Square Feet
- Features: Subdivided, 0 Up To 1/4 Acre
Details
- Parcel number: 0870890000013
Construction
Type & style
- Home type: SingleFamily
- Architectural style: Traditional
- Property subtype: Single Family Residence
Materials
- Unknown
- Foundation: Slab
- Roof: Composition
Condition
- New construction: No
- Year built: 1956
Utilities & green energy
- Sewer: Public Sewer
- Water: Public
Community & HOA
Community
- Subdivision: Cloverland Sec 03
Location
- Region: Houston
Financial & listing details
- Price per square foot: $155/sqft
- Tax assessed value: $117,899
- Annual tax amount: $2,506
- Date on market: 6/23/2026
- Listing terms: Cash,Conventional,FHA,Investor
Estimated market value
$181,200
$172,000 - $190,000
$1,720/mo
Price history
| Date | Event | Price |
|---|---|---|
| 5/14/2026 | Listed for sale | $189,000+2.2%$155/sqft |
Source: | ||
| 5/14/2026 | Listing removed | $185,000$152/sqft |
Source: | ||
| 5/9/2026 | Price change | $185,000-2.1%$152/sqft |
Source: | ||
| 4/2/2026 | Listed for sale | $189,000+5%$155/sqft |
Source: | ||
| 5/20/2024 | Listing removed | -- |
Source: | ||
| 4/17/2024 | Listing removed | -- |
Source: | ||
| 4/3/2024 | Price change | $180,000-2.7%$148/sqft |
Source: | ||
| 4/2/2024 | Listed for rent | $1,750-2.8%$1/sqft |
Source: | ||
| 4/1/2024 | Listing removed | -- |
Source: | ||
| 4/1/2024 | Listed for sale | $185,000$152/sqft |
Source: | ||
| 3/13/2024 | Pending sale | $185,000$152/sqft |
Source: | ||
| 3/6/2024 | Listed for rent | $1,800-21.7%$1/sqft |
Source: | ||
| 2/14/2024 | Listing removed | -- |
Source: | ||
| 2/13/2024 | Price change | $2,300+24.3%$2/sqft |
Source: | ||
| 1/19/2024 | Listed for rent | $1,850+8.8%$2/sqft |
Source: | ||
| 1/19/2024 | Listing removed | -- |
Source: | ||
| 1/3/2024 | Price change | $1,700-2.9%$1/sqft |
Source: | ||
| 12/21/2023 | Price change | $1,750-10.3%$1/sqft |
Source: | ||
| 12/15/2023 | Listed for rent | $1,950+9.9%$2/sqft |
Source: | ||
| 12/15/2023 | Listing removed | -- |
Source: | ||
| 11/29/2023 | Listed for rent | $1,775$1/sqft |
Source: | ||
Public tax history
| Year | Property taxes | Tax assessment |
|---|---|---|
| 2025 | $2,278 -19.1% | $117,899 -12.4% |
| 2024 | $2,818 +3.8% | $134,661 -15.1% |
| 2023 | $2,713 -12.6% | $158,589 +11.2% |
| 2022 | $3,106 | $142,655 +38.8% |
| 2021 | -- | $102,748 +33.7% |
| 2020 | $1,529 +8% | $76,856 +13.8% |
| 2019 | $1,416 -1.8% | $67,510 +15.5% |
| 2018 | $1,441 | $58,458 +2.5% |
| 2017 | $1,441 | $57,054 +29.9% |
| 2016 | -- | $43,931 +4.3% |
| 2015 | -- | $42,140 +27.2% |
| 2014 | -- | $33,116 |
| 2013 | -- | $33,116 |
| 2012 | -- | $33,116 -40.9% |
| 2011 | -- | $56,000 |
| 2010 | -- | $56,000 |
| 2009 | -- | $56,000 -9.8% |
| 2008 | -- | $62,113 |
| 2007 | -- | $62,113 +35.4% |
| 2006 | -- | $45,859 +10% |
| 2005 | -- | $41,690 +10% |
| 2004 | -- | $37,900 +9.9% |
| 2003 | -- | $34,500 +12.4% |
| 2002 | -- | $30,700 |
| 2001 | -- | $30,700 |
| 2000 | -- | $30,700 |
Find assessor info on the county website
Monthly payment
Est. payment$--/mo
Payment breakdown
Explore the cost of this home by adjusting the details. Changes won't be saved.All calculations are estimates and provided by Zillow, Inc. for informational purposes only. Actual amounts may vary.
HOA fees may include property taxes on listings classified as Co-Ops. Contact the listing agent and/or owner for fee details.
Mortgage interest rates are dependent on a number of factors, including credit score, down payment, and repayment length. Interest rate data provided by Zillow Group Marketplace, Inc. as of 1/1/1970 from various mortgage lenders with which we have lead or other similar arrangements; the Estimated Payment is an average of those rates.
See how much you could borrow to make a competitive offer.
Climate risks
Neighborhood: South Acres - Crestmont Park
Nearby schools
GreatSchools rating
- 4/10Law Elementary SchoolGrades: PK-5Distance: 0.6 mi
- 4/10Thomas Middle SchoolGrades: 6-8Distance: 1.5 mi
- 4/10Worthing High SchoolGrades: 9-12Distance: 1.7 mi
Schools provided by the listing agent
- Elementary: Law Elementary School
- Middle: Thomas Middle School
- High: Worthing High School
Source: HAR. This data may not be complete. We recommend contacting the local school district to confirm school assignments for this home.

A local agent can set up tours, give advice and negotiate with sellers.

Nearby cities
Nearby neighborhoods
Nearby zip codes
Other Houston Topics
